Contents
- Pandas Tutorial - 파이썬 데이터 분석 라이브러리
- Pandas 객체 생성하기 (Object creation)
- Pandas 데이터 보기 (Viewing data)
- Pandas 데이터 선택하기 (Selection)
- Pandas 누락된 데이터 (Missing data)
- Pandas 연산 (Operations)
- Pandas 병합하기 (Merge)
- Pandas 그룹 (Grouping)
- Pandas 형태 바꾸기 (Reshaping)
- Pandas 타임 시리즈 (Time series)
Tutorials
- Python Tutorial
- NumPy Tutorial
- Matplotlib Tutorial
- PyQt5 Tutorial
- BeautifulSoup Tutorial
- xlrd/xlwt Tutorial
- Pillow Tutorial
- Googletrans Tutorial
- PyWin32 Tutorial
- PyAutoGUI Tutorial
- Pyperclip Tutorial
- TensorFlow Tutorial
- Tips and Examples
Pandas 연산 (Operations)
◼︎ Table of Contents
1) DataFrame 만들기
예제
import pandas as pd
import numpy as np

np.random.seed(0)

dates = pd.date_range('20130101', periods=6)
df = pd.DataFrame(np.random.randn(6, 4), index=dates, columns=list('ABCD'))

s1 = pd.Series([1, 2, 3, 4, 5, 6], index=pd.date_range('20130102', periods=6))
df['F'] = s1
df.loc[:, 'D'] = np.array([5.0] * len(df))

print(df)
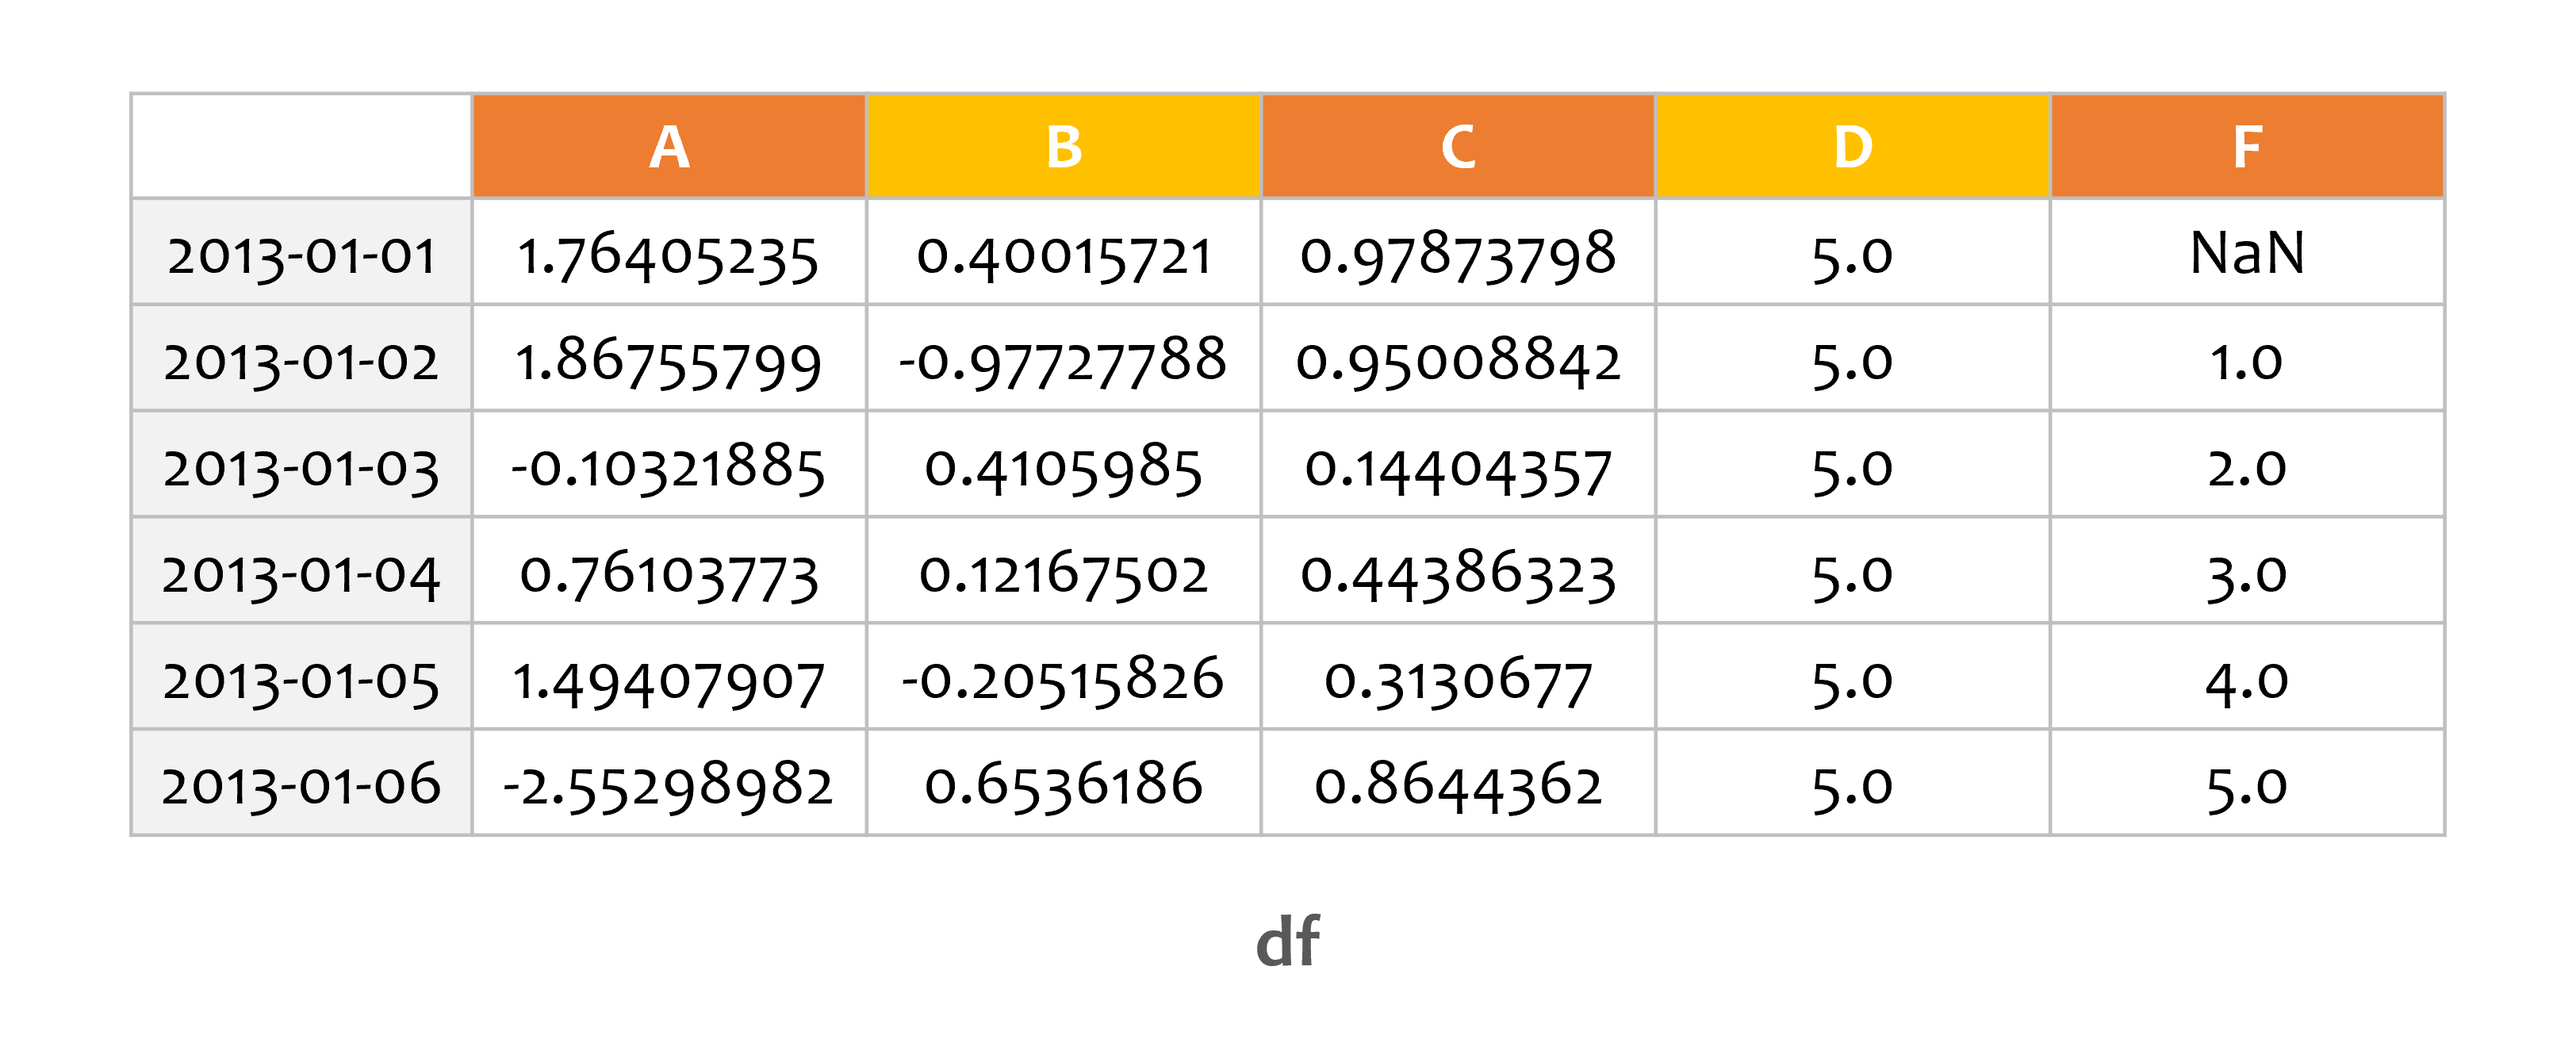
                   A         B         C    D    F
2013-01-01  1.764052  0.400157  0.978738  5.0  NaN
2013-01-02  1.867558 -0.977278  0.950088  5.0  1.0
2013-01-03 -0.103219  0.410599  0.144044  5.0  2.0
2013-01-04  0.761038  0.121675  0.443863  5.0  3.0
2013-01-05  1.494079 -0.205158  0.313068  5.0  4.0
2013-01-06 -2.552990  0.653619  0.864436  5.0  5.0
간단한 DataFrame을 하나 만들었습니다.
2) 통계적 분석
예제1
print(df.mean())
A    0.244411
B    0.000576
C    0.615706
D    5.000000
F    3.000000
dtype: float64
일반적으로 연산에는 누락된 데이터가 제외됩니다.
mean()을 사용하면 열에 따라 평균값을 얻습니다.
예제2
print(df.mean(1))
2013-01-01    1.494684
2013-01-02    1.568074
2013-01-03    1.490285
2013-01-04    1.865315
2013-01-05    2.120398
2013-01-06    1.793013
Freq: D, dtype: float64
mean(1)은 행 방향의 평균값을 반환합니다.
서로 다른 차원를 갖는 객체들 간의 연산은 정렬이 필요합니다.
또한 pandas는 지정한 차원을 따라 자동으로 브로드캐스트 (broadcast)합니다.
예제3
s = pd.Series([1, 3, 5, np.nan, 6, 8], index=dates).shift(2)

print(s)
print(df.sub(s, axis='index'))
2013-01-01    NaN
2013-01-02    NaN
2013-01-03    1.0
2013-01-04    3.0
2013-01-05    5.0
2013-01-06    NaN
Freq: D, dtype: float64

                   A         B         C    D    F
2013-01-01       NaN       NaN       NaN  NaN  NaN
2013-01-02       NaN       NaN       NaN  NaN  NaN
2013-01-03 -1.103219 -0.589401 -0.855956  4.0  1.0
2013-01-04 -2.238962 -2.878325 -2.556137  2.0  0.0
2013-01-05 -3.505921 -5.205158 -4.686932  0.0 -1.0
2013-01-06       NaN       NaN       NaN  NaN  NaN
Series를 하나 만들었습니다.
shift() 메서드는 지정한 숫자만큼 인덱스를 이동합니다.
df.sub(s, axis=’index’)연산은 DataFrame에서 Series에 해당하는 값을 뺍니다.
Series의 1, 2, 6번째 값이 존재하지 않기 때문에 DataFrame의 값들도 NaN이 됩니다.
3) 함수 적용하기
예제
print(df.apply(np.cumsum))
                   A         B         C     D     F
2013-01-01  1.764052  0.400157  0.978738   5.0   NaN
2013-01-02  3.631610 -0.577121  1.928826  10.0   1.0
2013-01-03  3.528391 -0.166522  2.072870  15.0   3.0
2013-01-04  4.289429 -0.044847  2.516733  20.0   6.0
2013-01-05  5.783508 -0.250005  2.829801  25.0  10.0
2013-01-06  3.230518  0.403613  3.694237  30.0  15.0
apply() 메서드는 DataFrame의 지정한 축을 따라 특정 함수를 적용하도록 합니다.
np.cumsum을 입력하면 누적 합을 계산합니다.
4) 히스토그램
예제1
s = pd.Series(np.random.randint(0, 7, size=10))

print(s)
0    4
1    2
2    0
3    0
4    4
5    5
6    5
7    6
8    0
9    4
dtype: int64
np.random.randint()를 사용해서 10개의 임의의 정수 Series를 갖는 Series를 하나 만들었습니다.
예제2
print(s.value_counts())
4    3
0    3
5    2
6    1
2    1
dtype: int64
value_counts()는 Series에서 특정 값이 몇 개 포함되어 있는지 보여줍니다.
4와 0이 3개, 5가 2개, 6과 2가 1개씩 포함되어 있음을 알 수 있습니다.
(Histogramming and Discretization 페이지 참고)
5) 문자열 메서드
예제
s = pd.Series(['A', 'B', 'C', 'Aaba', 'Baca', np.nan, 'CABA', 'dog', 'cat'])

print(s.str.lower())
0       a
1       b
2       c
3    aaba
4    baca
5     NaN
6    caba
7     dog
8     cat
dtype: object
Series는 str 속성 안에 문자열 처리 메서드를 갖고 있어서 어레이의 각 요소에 대해 작업하기 쉽습니다.
s.str.lower()는 Series s의 문자열을 소문자로 변환해서 반환합니다.
(Vectorized String Methods 페이지 참고)
