Contents
- Pandas Tutorial - 파이썬 데이터 분석 라이브러리
- Pandas 객체 생성하기 (Object creation)
- Pandas 데이터 보기 (Viewing data)
- Pandas 데이터 선택하기 (Selection)
- Pandas 누락된 데이터 (Missing data)
- Pandas 연산 (Operations)
- Pandas 병합하기 (Merge)
- Pandas 그룹 (Grouping)
- Pandas 형태 바꾸기 (Reshaping)
- Pandas 타임 시리즈 (Time series)
Tutorials
- Python Tutorial
- NumPy Tutorial
- Matplotlib Tutorial
- PyQt5 Tutorial
- BeautifulSoup Tutorial
- xlrd/xlwt Tutorial
- Pillow Tutorial
- Googletrans Tutorial
- PyWin32 Tutorial
- PyAutoGUI Tutorial
- Pyperclip Tutorial
- TensorFlow Tutorial
- Tips and Examples
Pandas 데이터 보기 (Viewing data)
Pandas 객체의 데이터를 확인하는 다양한 방법에 대해 소개합니다.
순서는 아래와 같습니다.
◼︎ Table of Contents
1) DataFrame 만들기
예제
import pandas as pd
import numpy as np

dates = pd.date_range('20130101', periods=6)
df = pd.DataFrame(np.random.randn(6, 4), index=dates, columns=list('ABCD'))

print(df.head(2))
print(df.tail(3))
                   A         B         C         D
2013-01-01  1.764052  0.400157  0.978738  2.240893
2013-01-02  1.867558 -0.977278  0.950088 -0.151357
2013-01-03 -0.103219  0.410599  0.144044  1.454274
2013-01-04  0.761038  0.121675  0.443863  0.333674
2013-01-05  1.494079 -0.205158  0.313068 -0.854096
2013-01-06 -2.552990  0.653619  0.864436 -0.742165
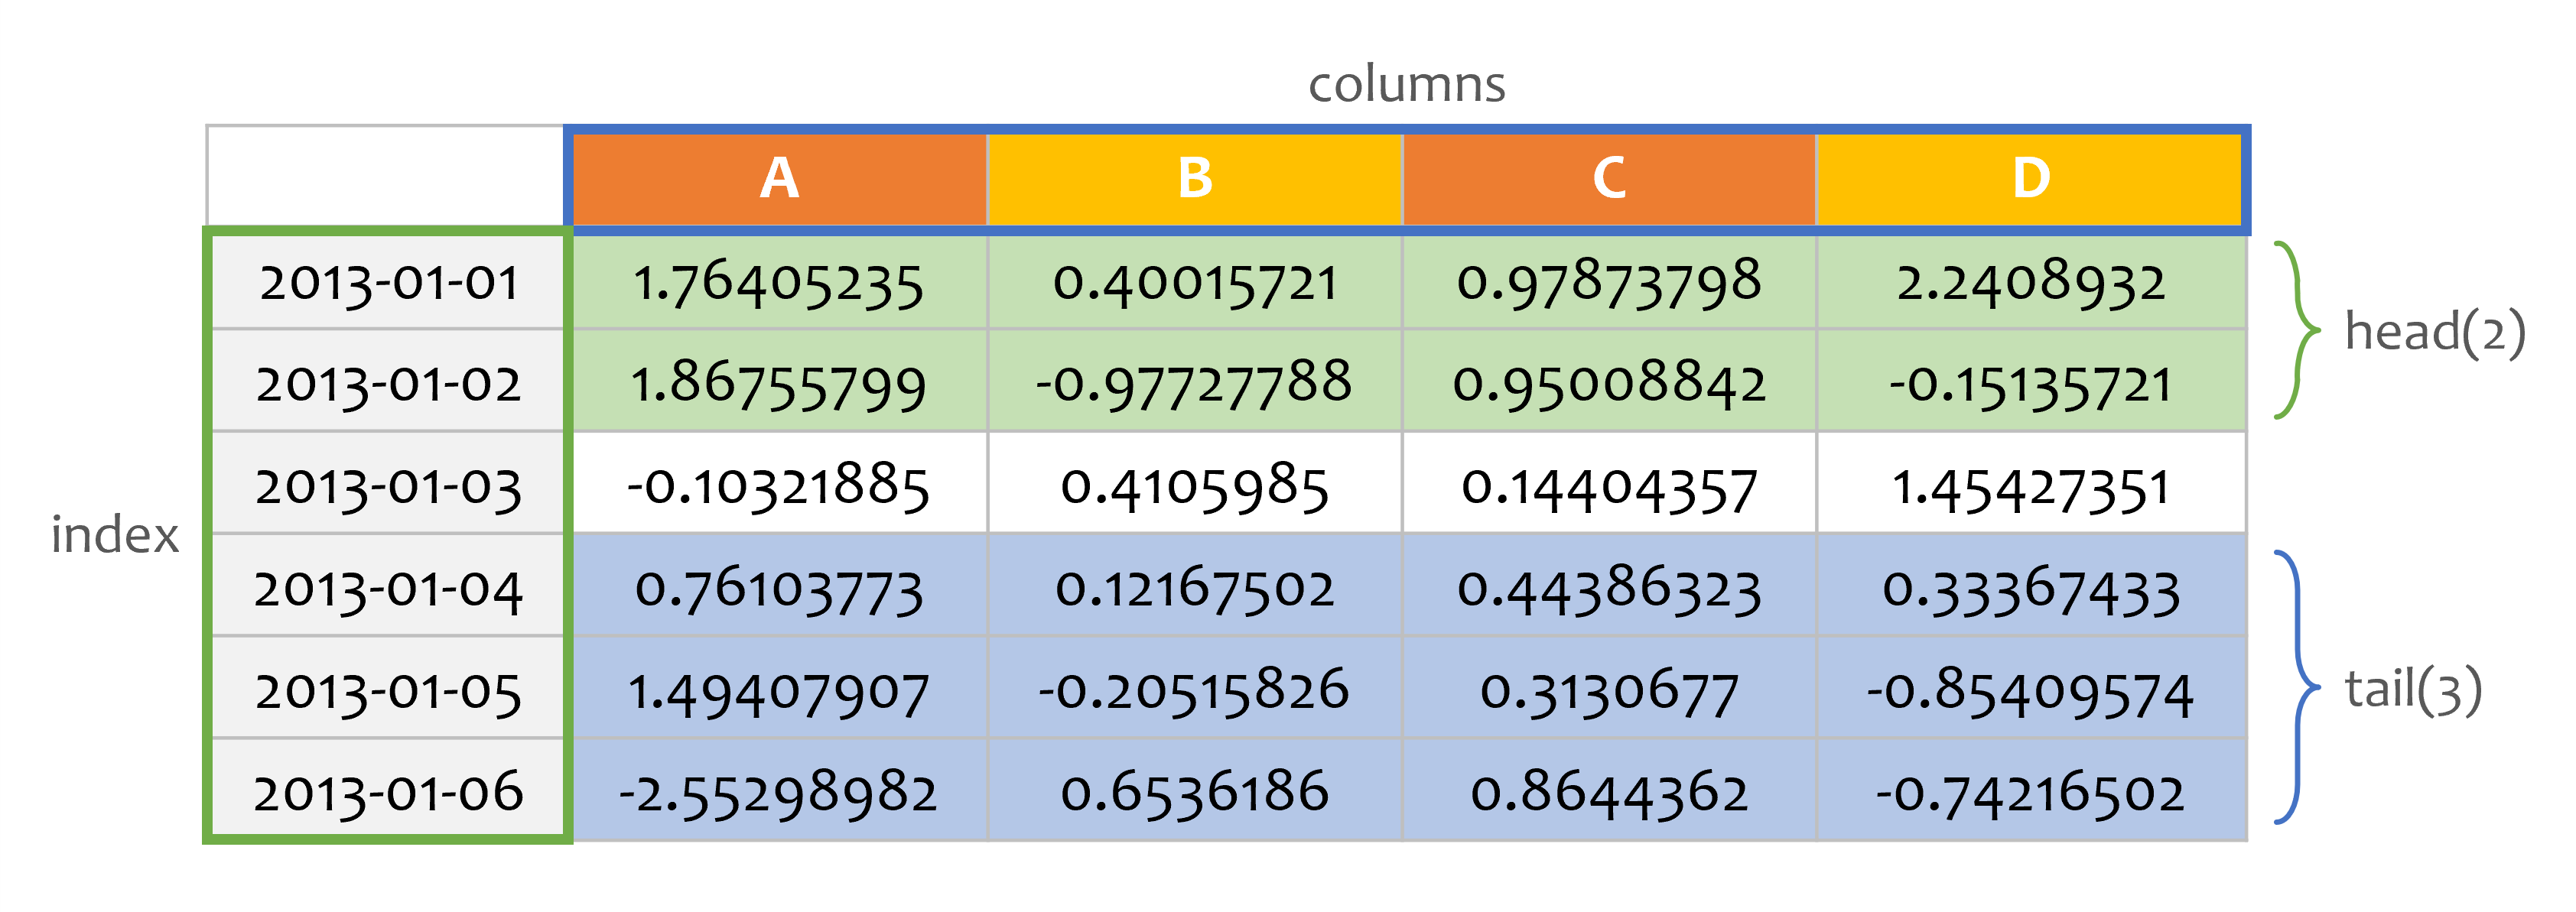
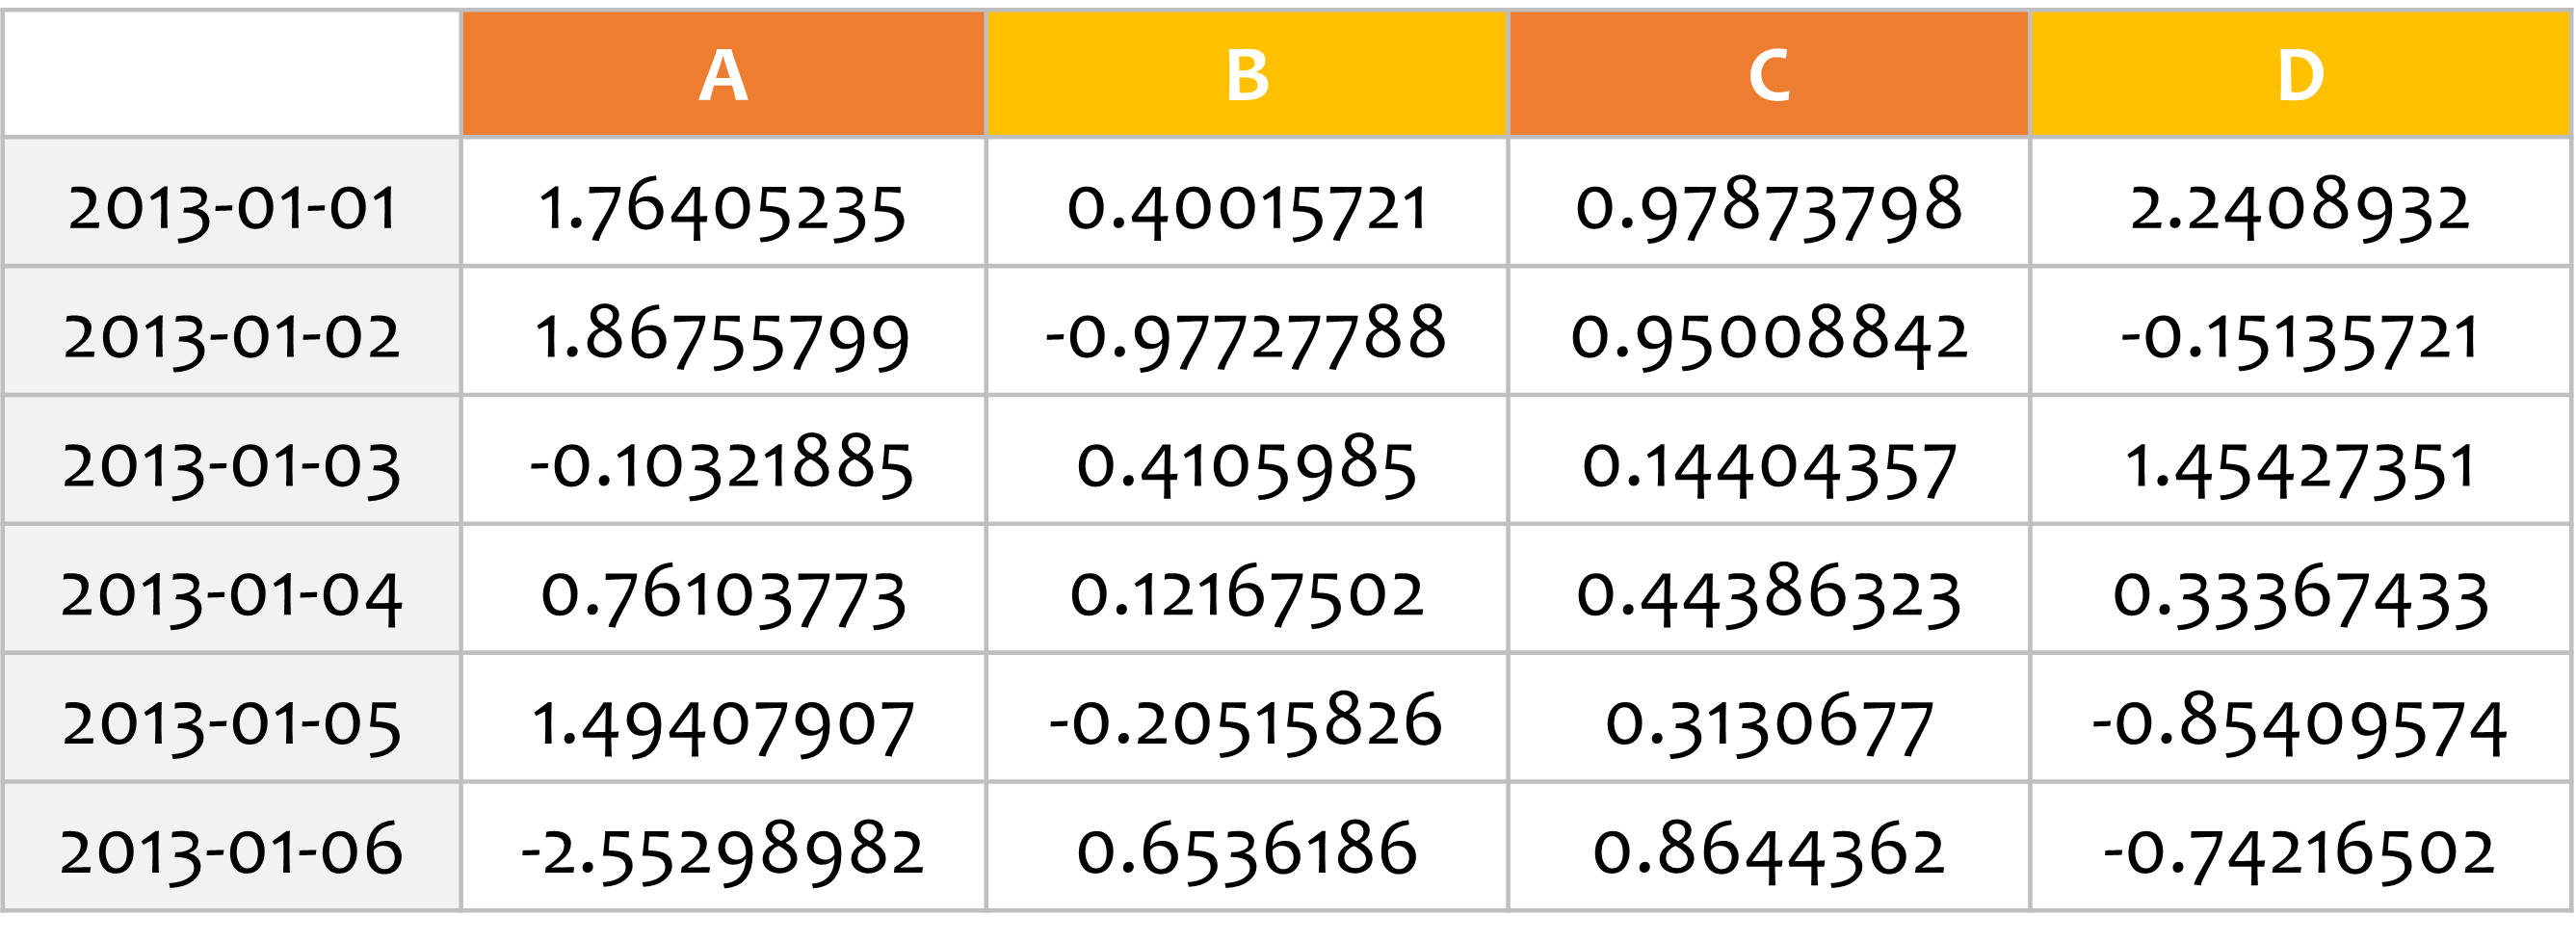
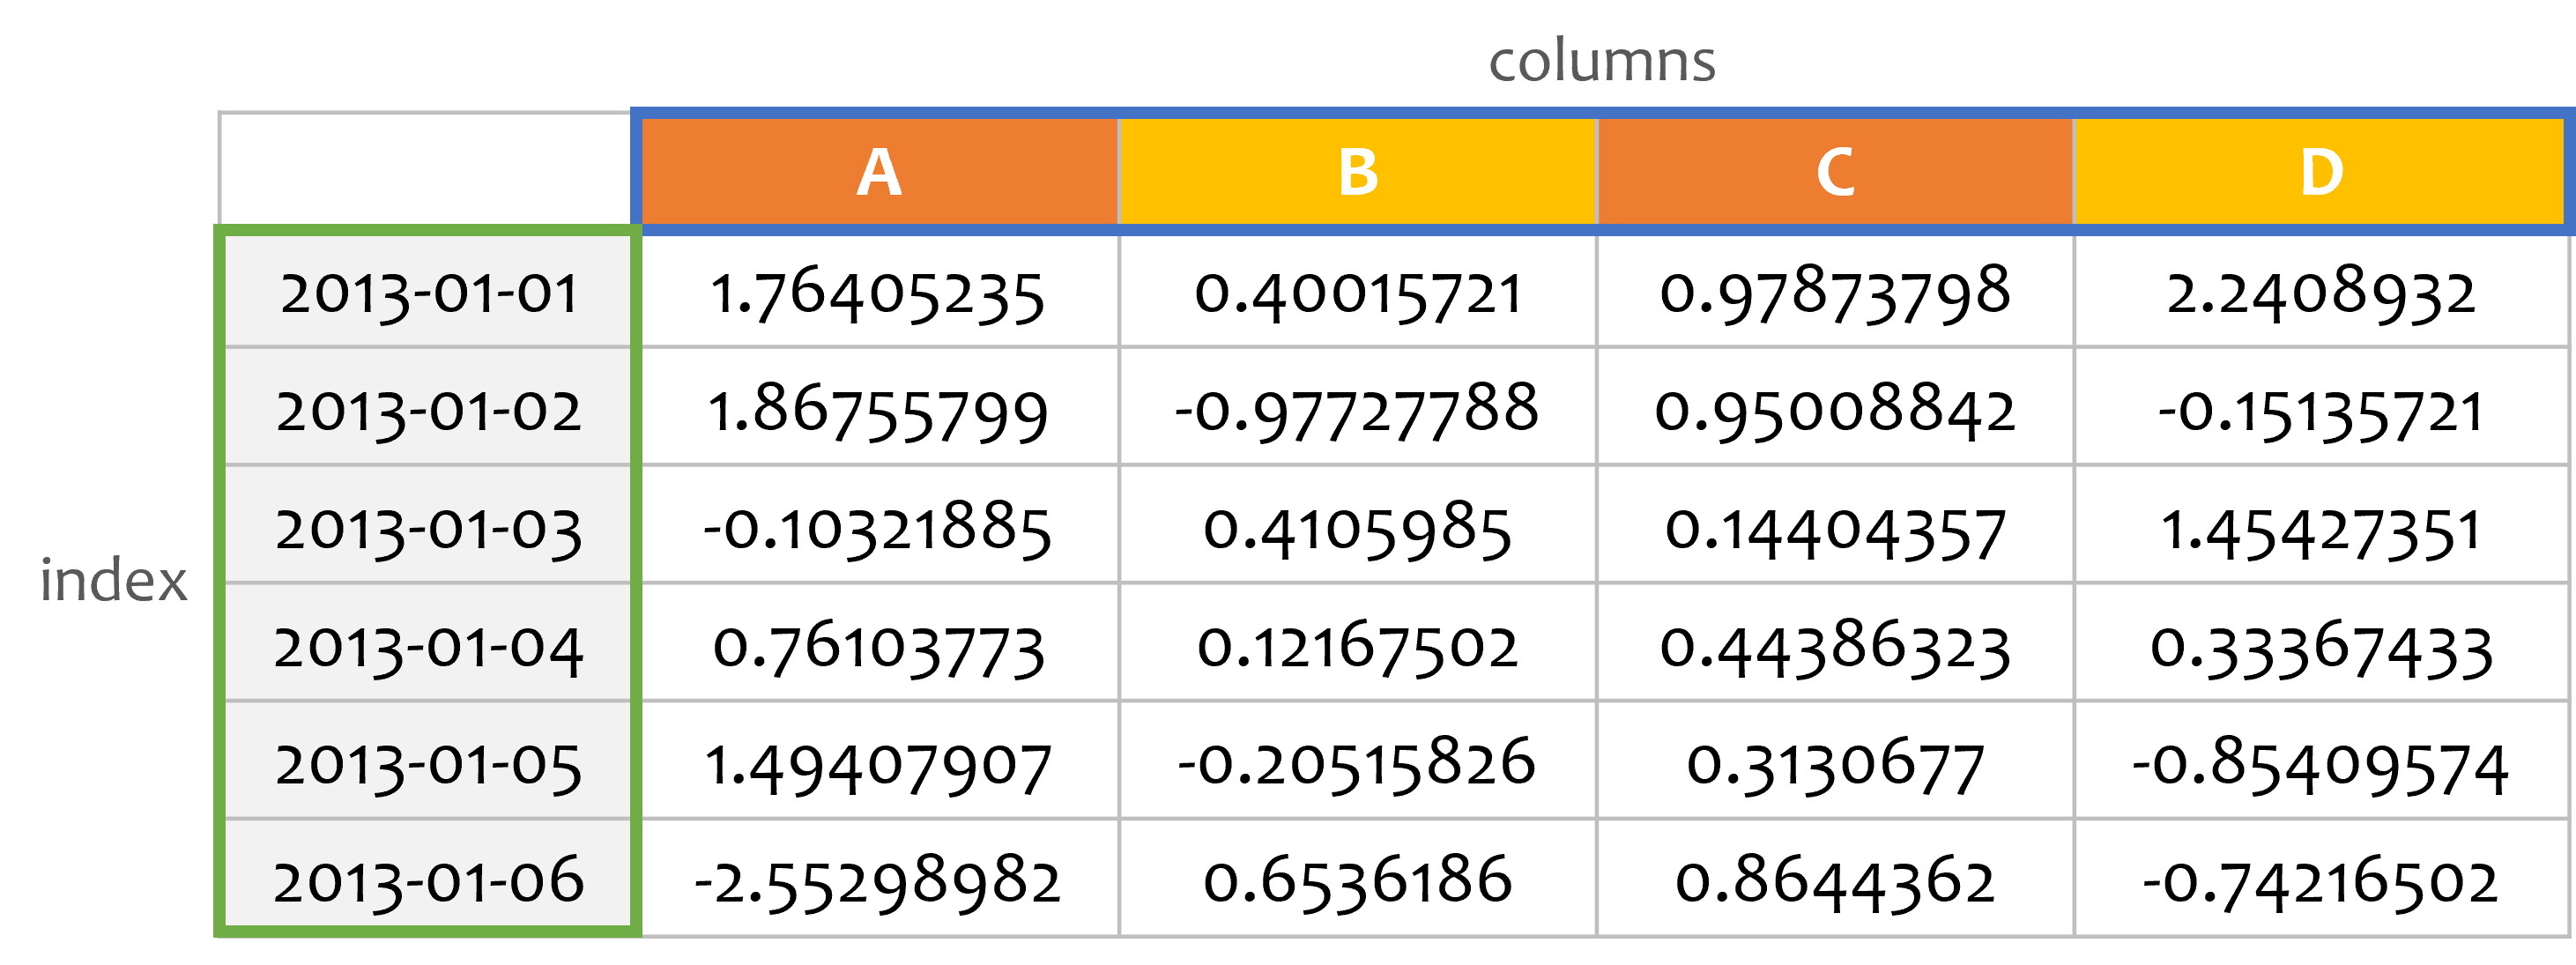
date_range() 함수를 사용해서 ‘20130101’을 시작으로 하는 6개의 DatetimeIndex를 만들었습니다.
또한 np.random.randn() 함수를 사용해서 임의의 숫자 데이터를 갖는 DataFrame을 만들었습니다.
2) df.head() / df.tail()
예제
import pandas as pd
import numpy as np

dates = pd.date_range('20130101', periods=6)
df = pd.DataFrame(np.random.randn(6, 4), index=dates, columns=list('ABCD'))

print(df.head(2))
print(df.tail(3))
                   A         B         C         D
2013-01-01 -1.609018 -1.546046  1.594722  0.251137
2013-01-02  0.590297  0.944036  1.611781 -0.803152
                   A         B         C         D
2013-01-04  0.505909 -0.673781 -0.836765 -1.156259
2013-01-05  0.787691  0.057011 -1.266527  0.255031
2013-01-06 -1.228166  1.518779  0.158763 -1.400699
df.head()과 df.tail()을 사용하면 각각 DataFrame의 위, 아래에서부터 몇 개의 행을 얻을 수 있습니다.
예제에서는 위에서 두 개의 행, 그리고 아래에서 세 개의 행을 출력했습니다.
3) df.index / df.columns
예제
print(df.index)
print(df.columns)
DatetimeIndex(['2013-01-01', '2013-01-02', '2013-01-03', '2013-01-04',
             '2013-01-05', '2013-01-06'],
            dtype='datetime64[ns]', freq='D')
Index(['A', 'B', 'C', 'D'], dtype='object')
인덱스와 열의 레이블을 출력하려면, index와 columns을 사용합니다.
4) df.to_numpy()
예제
print(df.to_numpy())
[[-0.04219132 -0.78509062  1.82118794 -0.50527708]
[ 1.25552344  2.56573571  2.15202539  1.09998264]
[-0.16830456  0.58679295  0.39410187 -2.0896648 ]
[ 0.58638001 -0.7350871  -0.79163044  1.9113404 ]
[ 0.41635159  0.41550025 -0.5673976   0.515888  ]
[-1.05598448  0.01596972  0.78679791 -0.39670978]]
to_numpy()는 데이터를 NumPy 방식으로 표현하도록 합니다.
하지만 DataFrame이 서로 다른 자료형을 갖고 있다면, NumPy와 pandas의 근본적인 차이로 인해 비용이 많이 드는 작업입니다.
NumPy 어레이는 전체 어레이에 대해 하나의 자료형 (dtype)을 가지지만, pandas의 DataFrame은 열마다 하나의 자료형을 가집니다.
to_numpy()를 호출하면, pandas는 DataFrame의 자료형을 모두 담을 수 있는 NumPy 자료형을 찾습니다.
모두 부동소수점 값을 갖는 DataFrame에 대해, to_numpy()은 빠르며 데이터를 복사할 필요가 없습니다.
5) df.describe()
예제
print(df.describe())
              A         B         C         D
count  6.000000  6.000000  6.000000  6.000000
mean  -0.639661  0.340606  0.496345 -0.735567
std    1.138222  0.539525  0.825652  1.204526
min   -2.616421 -0.436817 -0.750089 -2.472597
25%   -0.775621 -0.046407  0.020717 -1.591189
50%   -0.699894  0.620223  0.606058 -0.397725
75%    0.127015  0.686802  1.123276  0.239462
max    0.576453  0.799630  1.394758  0.391798
df.describe()은 데이터에 대한 통계적 요약을 보여줍니다.
데이터의 개수, 평균, 표준편차, 최대/최소 값 등을 간편하게 얻을 수 있습니다.
6) df.T
예제
print(df.T)
   2013-01-01  2013-01-02  ...  2013-01-05  2013-01-06
A    0.006339    2.222076  ...    1.241407   -0.834424
B   -0.435354   -0.094142  ...   -0.173779   -1.865298
C   -1.146673    0.465518  ...    0.623905   -1.624581
D    1.477844    0.765829  ...    0.757412   -0.908118

[4 rows x 6 columns]
df.T는 DataFrame의 행과 열을 교환 (transpose)합니다.
7) df.sort_index()
예제
print(df.sort_index(axis=1, ascending=False))
                   D         C         B         A
2013-01-01 -0.005029  0.414458  0.399829  0.654783
2013-01-02  2.341468  1.183852 -0.593157  2.208687
2013-01-03  0.108123 -0.177902 -0.091888 -0.648707
2013-01-04  1.370133 -0.164616  0.203826 -0.111991
2013-01-05  1.594731  1.210591 -0.196160  1.304416
2013-01-06  1.515683 -0.206454 -0.194870 -0.257422
df.sort_index()를 사용해서 축을 정렬할 수 있습니다.
예제에서는 첫번째 축을 따라 내림차순으로 정렬했습니다.
8) df.sort_values()
예제
print(df.sort_values(by='B'))
                   A         B         C         D
2013-01-01 -0.384324 -0.812817 -0.136048  0.282506
2013-01-06  0.906194 -0.422318  1.358811 -0.523248
2013-01-03  0.036848  0.410957 -0.872071  0.020571
2013-01-05  0.643707  0.876459 -1.378311 -0.179811
2013-01-02 -0.662058  1.007308 -1.390414 -1.171969
2013-01-04 -0.575577  1.254676  1.386749  1.073495
df.sort_index()를 사용해서 축을 정렬할 수 있습니다.
예제에서는 두번째 열의 값의 크기에 따라 DataFrame을 정렬했습니다.


