Contents
- Pandas Tutorial - 파이썬 데이터 분석 라이브러리
- Pandas 객체 생성하기 (Object creation)
- Pandas 데이터 보기 (Viewing data)
- Pandas 데이터 선택하기 (Selection)
- Pandas 누락된 데이터 (Missing data)
- Pandas 연산 (Operations)
- Pandas 병합하기 (Merge)
- Pandas 그룹 (Grouping)
- Pandas 형태 바꾸기 (Reshaping)
- Pandas 타임 시리즈 (Time series)
Tutorials
- Python Tutorial
- NumPy Tutorial
- Matplotlib Tutorial
- PyQt5 Tutorial
- BeautifulSoup Tutorial
- xlrd/xlwt Tutorial
- Pillow Tutorial
- Googletrans Tutorial
- PyWin32 Tutorial
- PyAutoGUI Tutorial
- Pyperclip Tutorial
- TensorFlow Tutorial
- Tips and Examples
Pandas 형태 바꾸기 (Reshaping)
◼︎ Table of Contents
1) DataFrame 만들기
예제1
import pandas as pd
import numpy as np

tuples = list(
    zip(
        *[
            ['bar', 'bar', 'baz', 'baz', 'foo', 'foo', 'qux', 'qux'],
            ['one', 'two', 'one', 'two', 'one', 'two', 'one', 'two'],
        ]
        )
    )

index = pd.MultiIndex.from_tuples(tuples, names=['first', 'second'])

df = pd.DataFrame(np.random.randn(8, 2), index=index, columns=['A', 'B'])

print(df)
                     A         B
first second
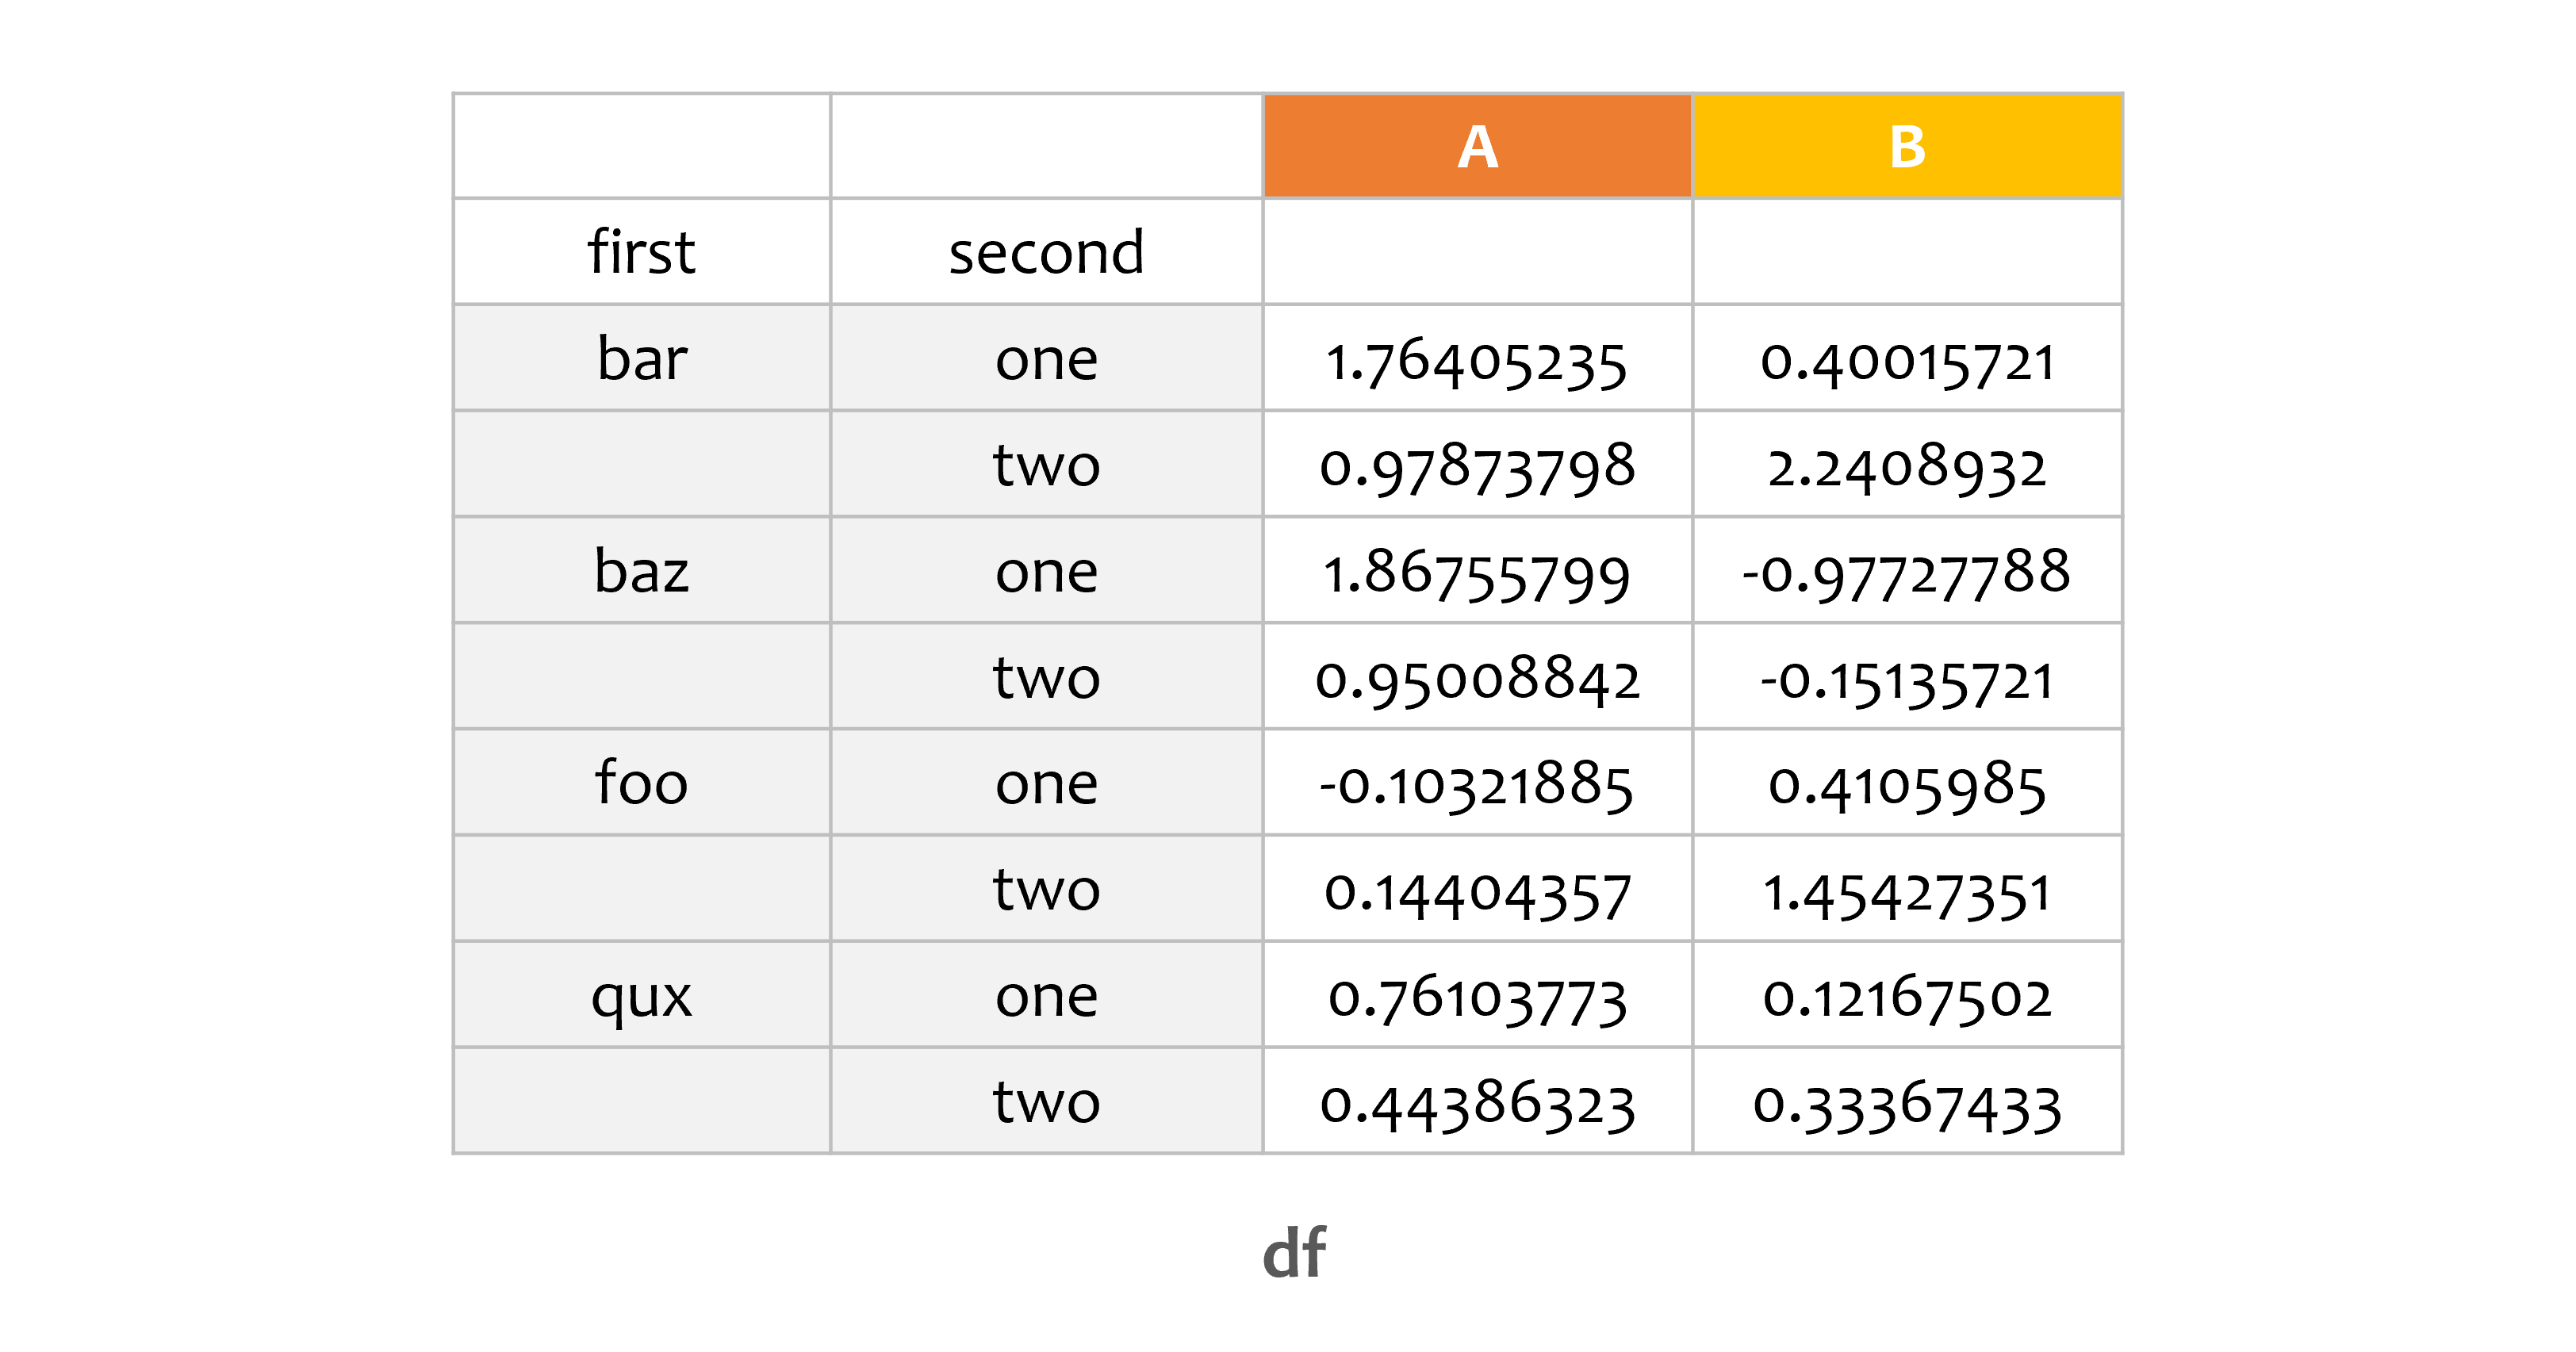
bar   one     1.764052  0.400157
      two     0.978738  2.240893
baz   one     1.867558 -0.977278
      two     0.950088 -0.151357
foo   one    -0.103219  0.410599
      two     0.144044  1.454274
qux   one     0.761038  0.121675
      two     0.443863  0.333674
두 개의 인덱스를 갖는 DataFrame을 하나 만들었습니다.
예제2
df2 = df[:4]

print(df2)
                     A         B
first second
bar   one     1.764052  0.400157
      two     0.978738  2.240893
baz   one     1.867558 -0.977278
      two     0.950088 -0.151357
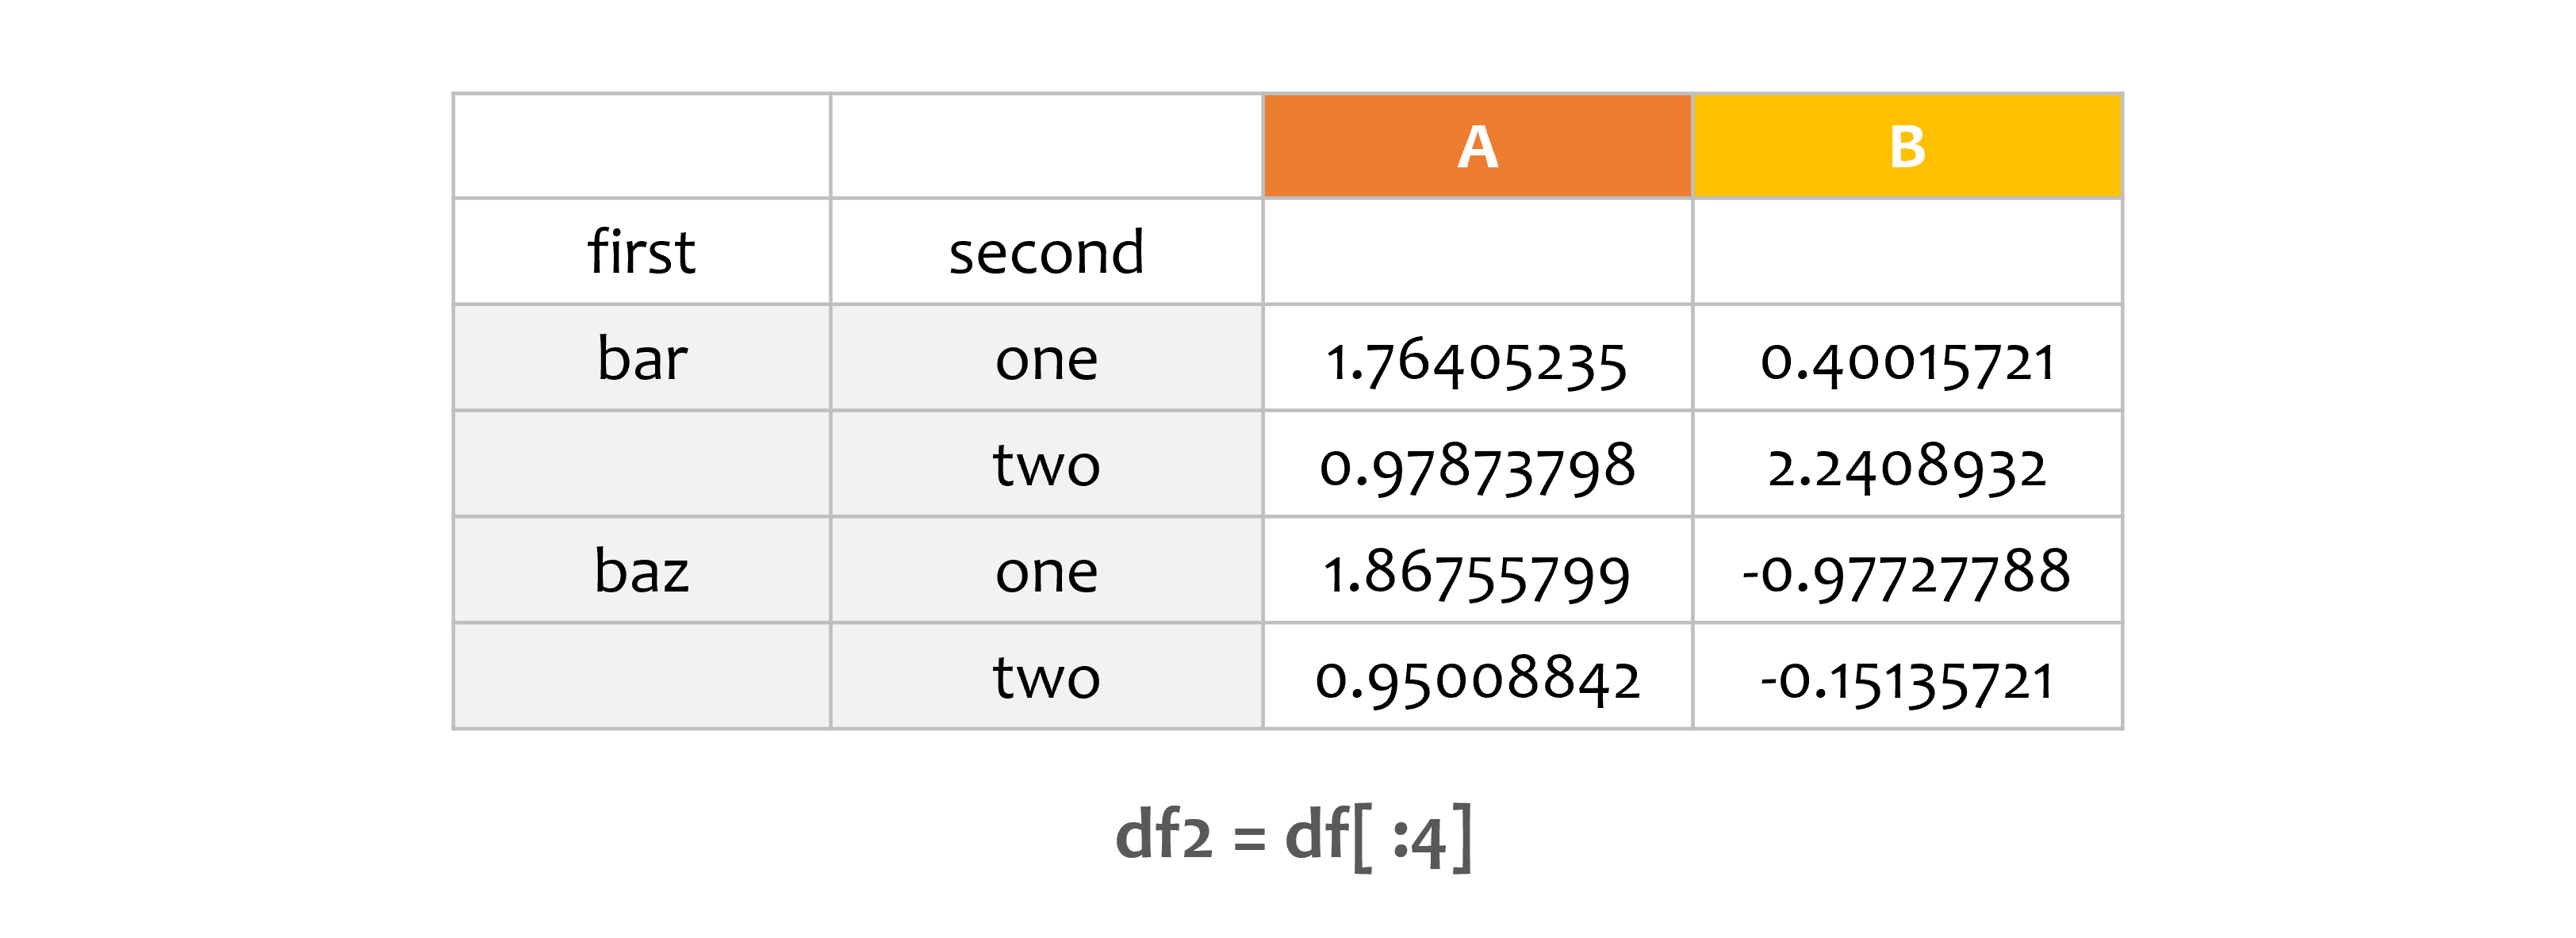
위에서 네 개의 행을 선택합니다.
2) Stack
예제1
stacked = df2.stack()

print(stacked)
first  second
bar    one     A    1.764052
               B    0.400157
       two     A    0.978738
               B    2.240893
baz    one     A    1.867558
               B   -0.977278
       two     A    0.950088
               B   -0.151357
dtype: float64
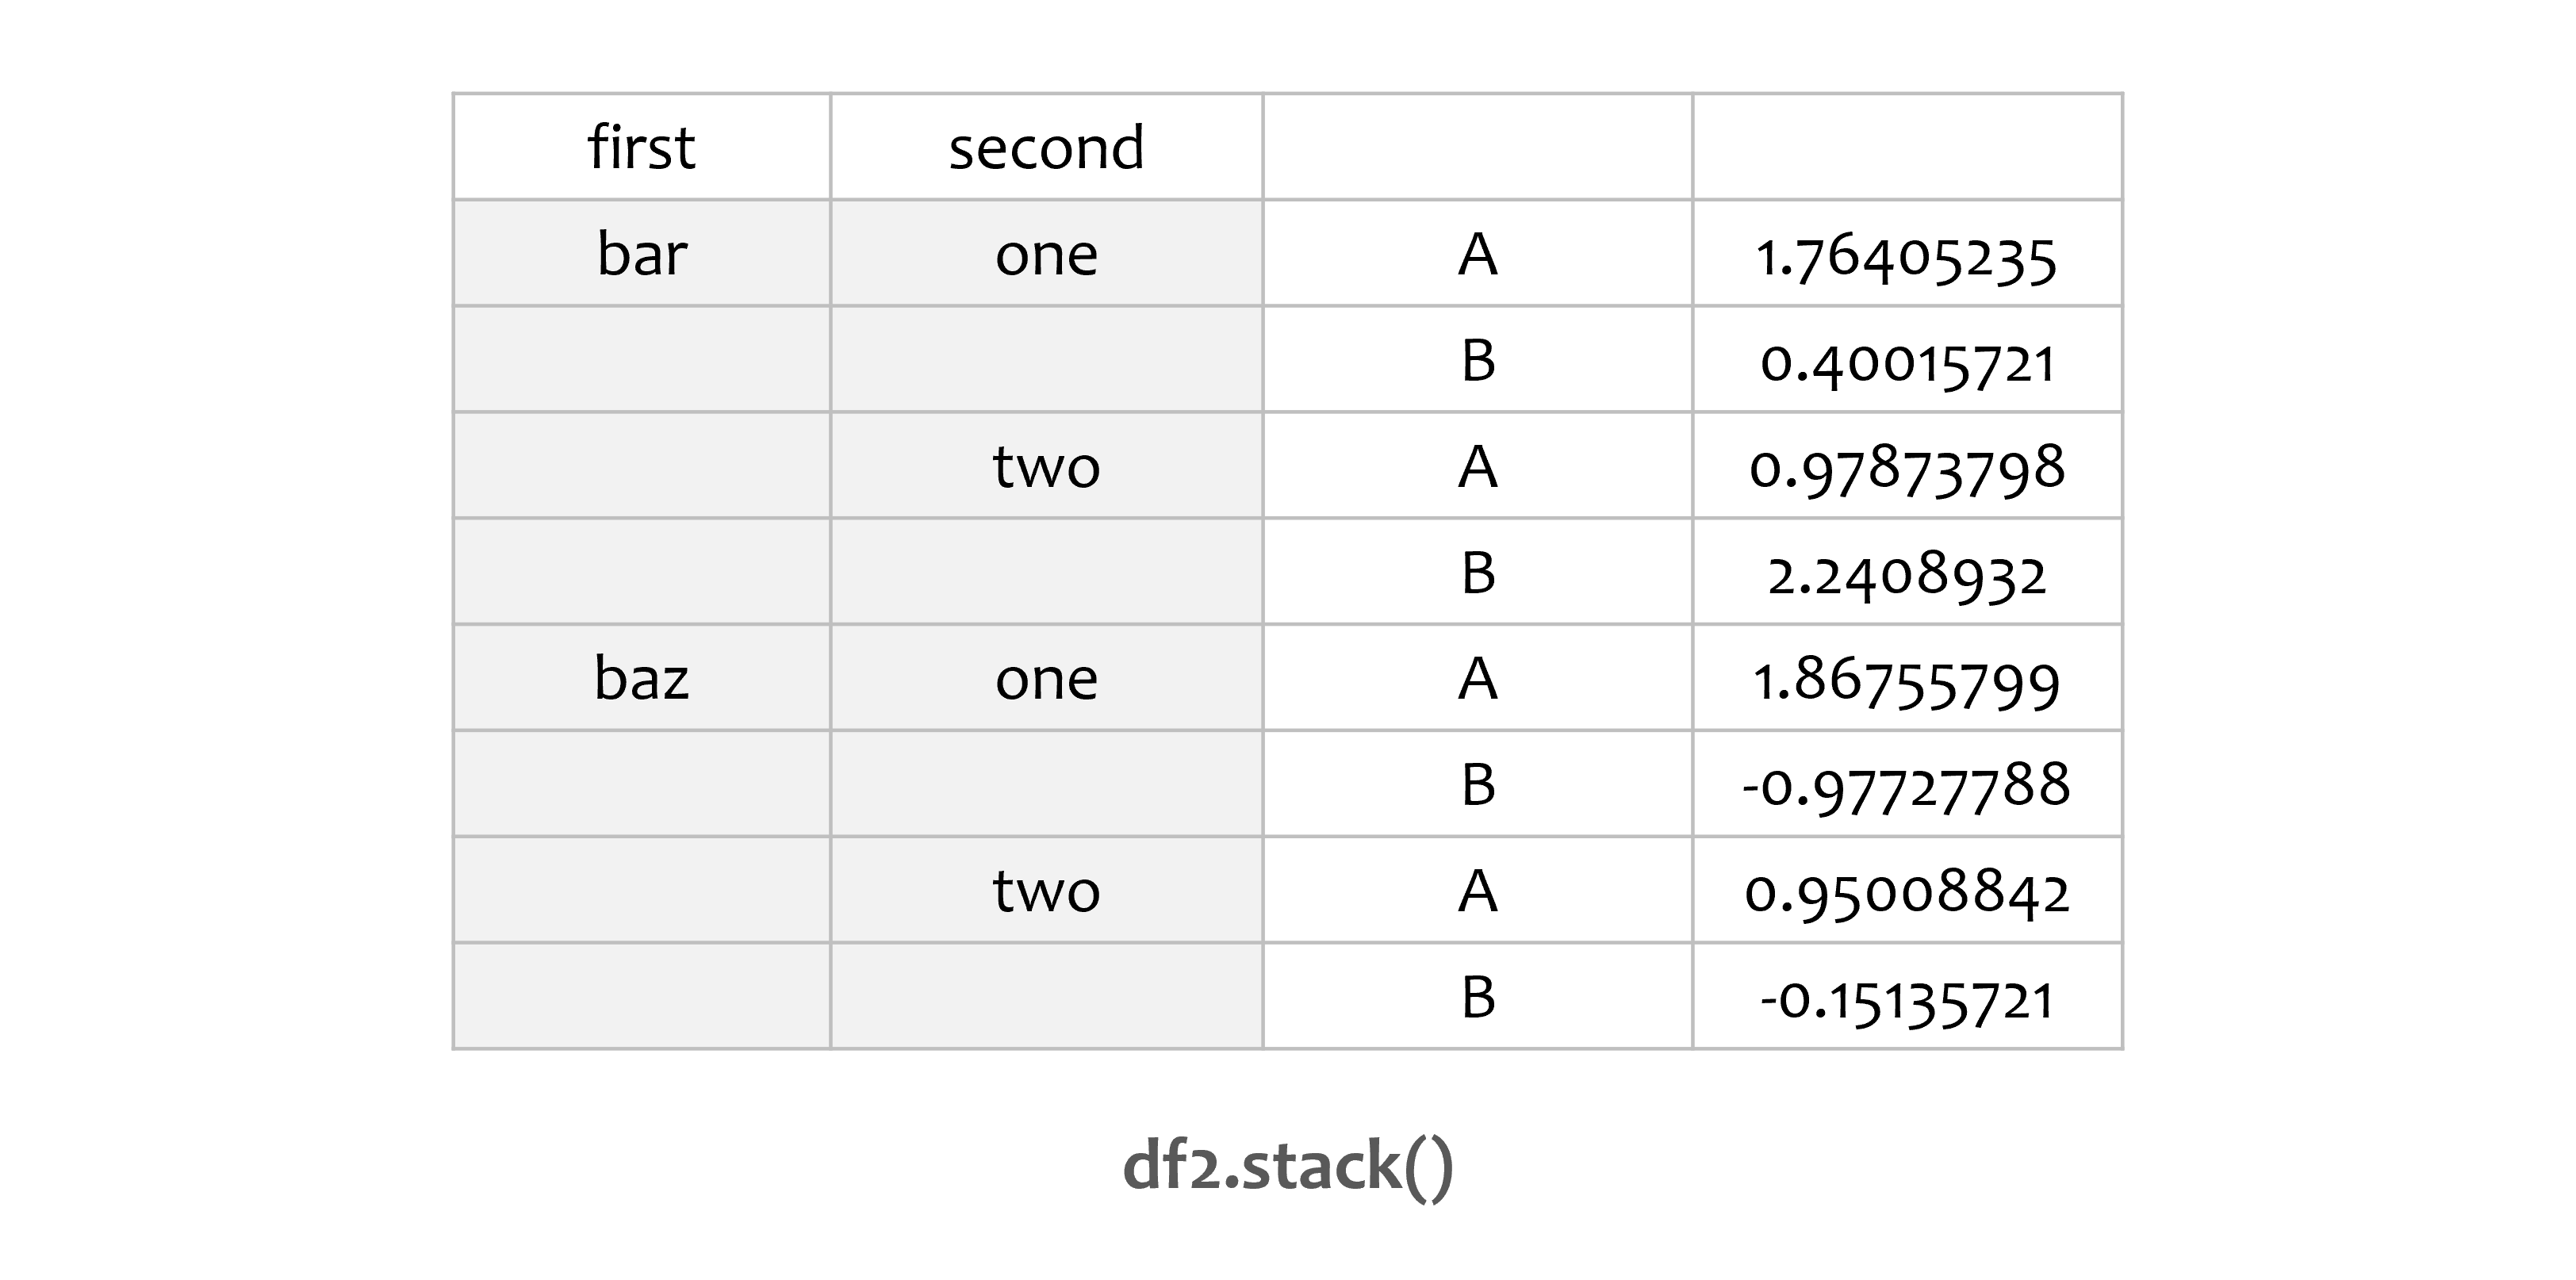
stack() 메서드는 DataFrame의 열에 있는 레벨을 ‘압축’합니다.
예제2
print(stacked.unstack())
                     A         B
first second
bar   one     1.764052  0.400157
      two     0.978738  2.240893
baz   one     1.867558 -0.977278
      two     0.950088 -0.151357
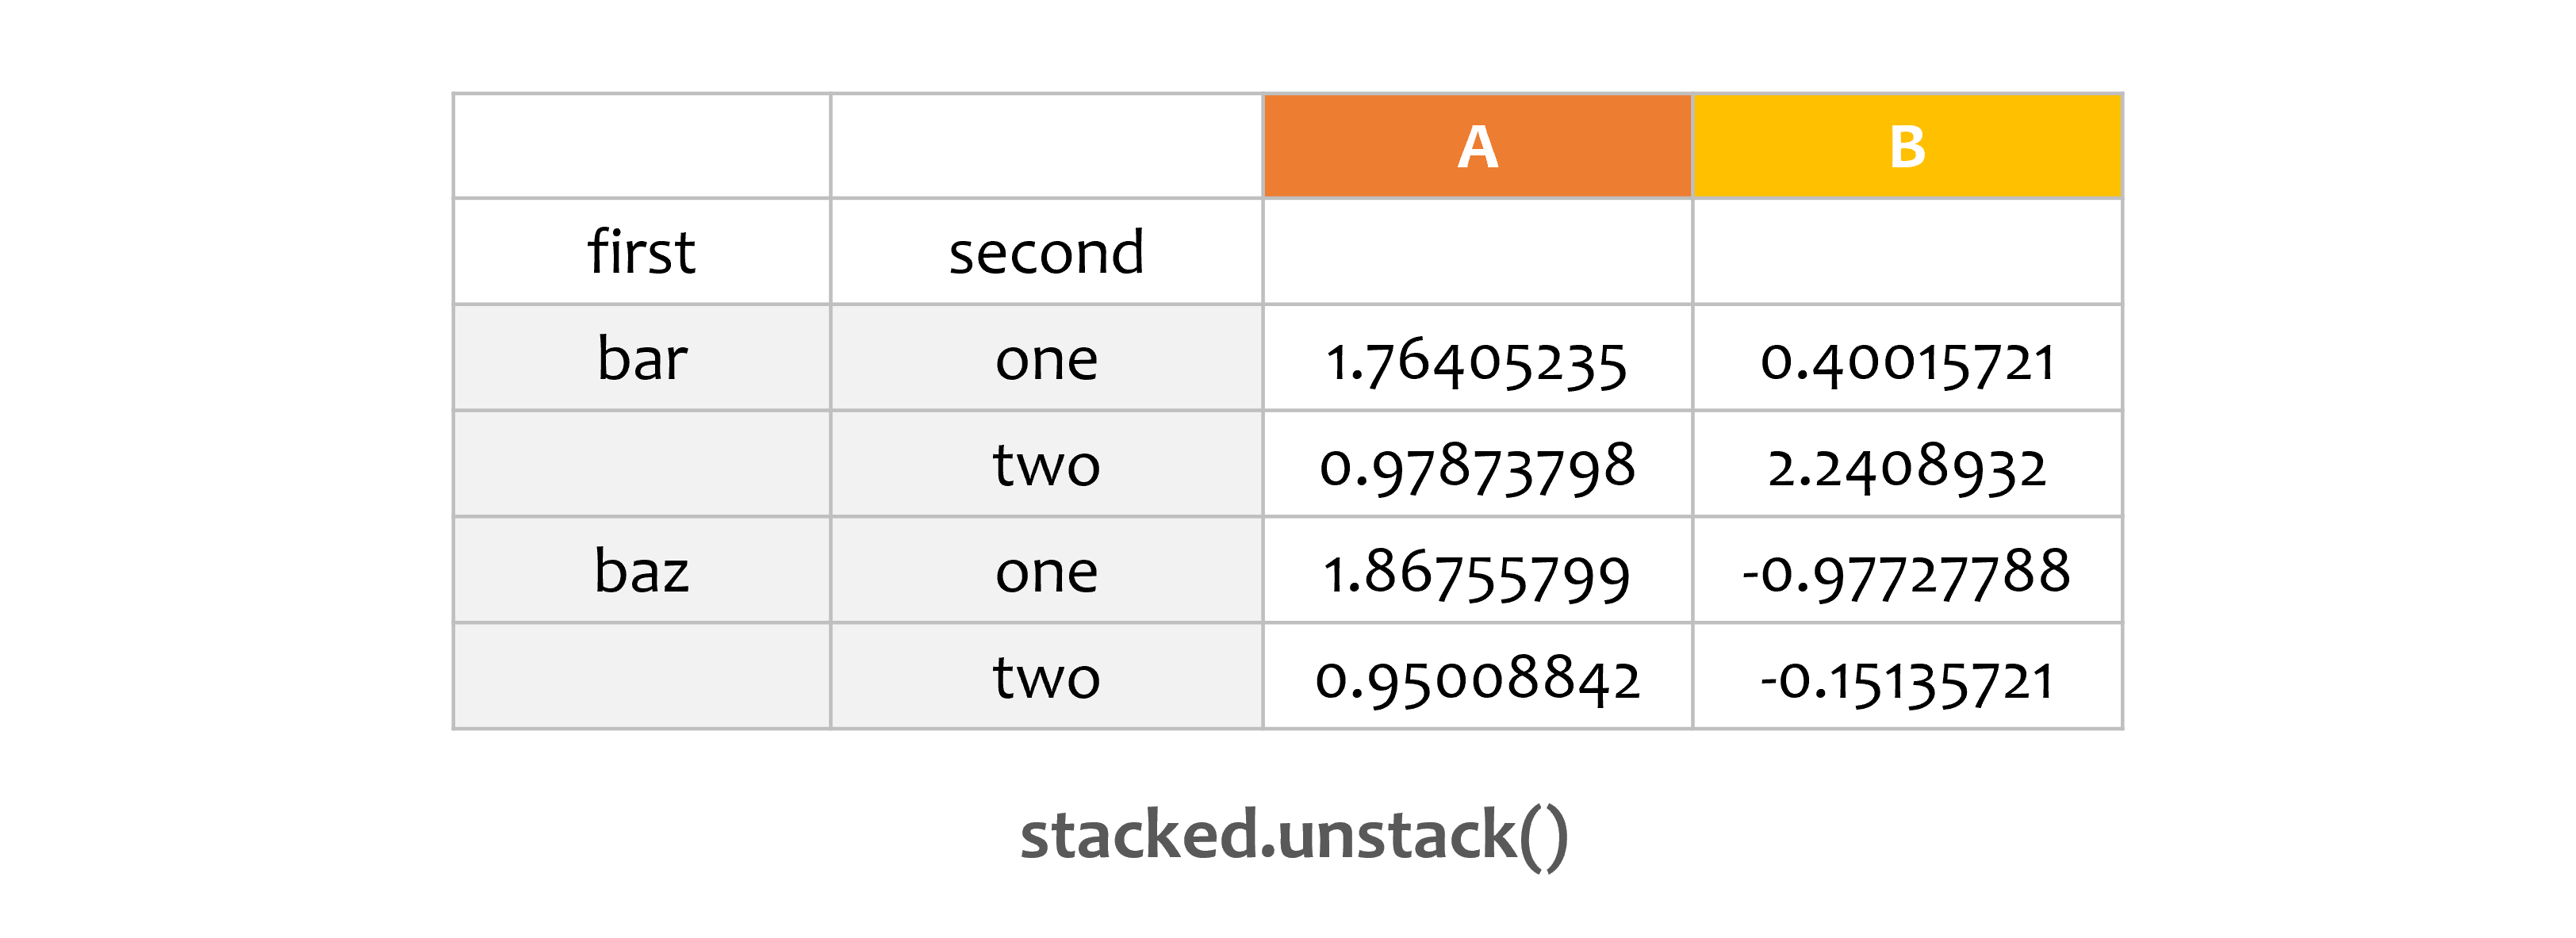
(여러 개의 인덱스를 갖는) ‘stacked’ DataFrame과 Series에 대해,
stack()의 반대 연산은 unstack()입니다.
unstack 연산은 기본적으로 마지막 레벨에 대해 수행합니다.
3) Pivot tables
예제1
df = pd.DataFrame({'A': ['one', 'one', 'two', 'three'] * 3,
                 'B': ['A', 'B', 'C'] * 4,
                 'C': ['foo', 'foo', 'foo', 'bar', 'bar', 'bar'] * 2,
                 'D': np.random.randn(12),
                 'E': np.random.randn(12)})

print(df)
        A  B    C         D         E
0     one  A  foo  1.494079  1.532779
1     one  B  foo -0.205158  1.469359
2     two  C  foo  0.313068  0.154947
3   three  A  bar -0.854096  0.378163
4     one  B  bar -2.552990 -0.887786
5     one  C  bar  0.653619 -1.980796
6     two  A  foo  0.864436 -0.347912
7   three  B  foo -0.742165  0.156349
8     one  C  foo  2.269755  1.230291
9     one  A  bar -1.454366  1.202380
10    two  B  bar  0.045759 -0.387327
11  three  C  bar -0.187184 -0.302303
다시 DataFrame을 하나 만들었습니다.
예제2
pt = pd.pivot_table(df, values='D', index=['A', 'B'], columns=['C'])
print(pt)
C             bar       foo
A     B
one   A -1.454366  1.494079
      B -2.552990 -0.205158
      C  0.653619  2.269755
three A -0.854096       NaN
      B       NaN -0.742165
      C -0.187184       NaN
two   A       NaN  0.864436
      B  0.045759       NaN
      C       NaN  0.313068
pivot_table()을 사용해서 위의 데이터로부터 간편하게 피벗 테이블 (pivot table)을 만들 수 있습니다.
(Pivot Tables 참고)
이전글/다음글
이전글 : Pandas 그룹 (Grouping)


