배치와 연결 (3) - 도형 연결하기
이전 페이지에서 특정 평면에서 사각형 상자를 가장 작은 면적으로 배치하는 방법에 대해 소개했습니다.
이번에는 이렇게 배치된 네 개의 상자를 미리 정해진대로 연결하는 과정에 대해 소개합니다.
■ Table of Contents
1) 가장 작은 면적을 갖도록 배치하기
import numpy as np
import matplotlib.pyplot as plt
import matplotlib.patches as patches


def draw_rect(canvas, rectangle):
    (x, y, w, h) = rectangle
    canvas[y:y+h, x:x+w] = len(rect_info)


def find_place(canvas, rectangle):
    w_rect, h_rect = rectangle[2], rectangle[3]
    options = []
    for i in range(height - h_rect + 1):
        for j in range(width - w_rect + 1):
            if not np.any(canvas[i:i+h_rect, j:j+w_rect]):
                options.append((j, i))
    rand = np.random.randint(len(options))
    return options[rand]


width, height = 10, 10
new_rect = [[0, 0, 4, 4], [0, 0, 3, 4], [0, 0, 4, 2], [0, 0, 3, 2]]
record_x, record_y = 10, 10
record_rect_info = []
num_episodes = 1000

for n in range(num_episodes):
    canvas1 = np.zeros((height, width))
    rect_info = []
    for rect in new_rect:
        rect[0], rect[1] = find_place(canvas1, rect)
        rect_info.append(tuple(rect))
        draw_rect(canvas1, rect)

    max_x = max(np.array(rect_info)[:, 0] + np.array(rect_info)[:, 2])
    max_y = max(np.array(rect_info)[:, 1] + np.array(rect_info)[:, 3])
    if max_x <= record_x and max_y <= record_y:
        record_rect_info = rect_info
        record_x, record_y = max_x, max_y

plt.style.use('default')
plt.rcParams['figure.figsize'] = (6, 6)
plt.rcParams['font.size'] = 12

fig, ax = plt.subplots()
for (x, y, w, h) in record_rect_info:
    ax.add_patch(
        patches.Rectangle(
            (x, y), w, h,
            edgecolor='royalblue',
            facecolor='lightsteelblue',
            linewidth=0.5,
            fill=True))

ax.axis((0, 10, 10, 0))
ax.xaxis.tick_top()
plt.show()
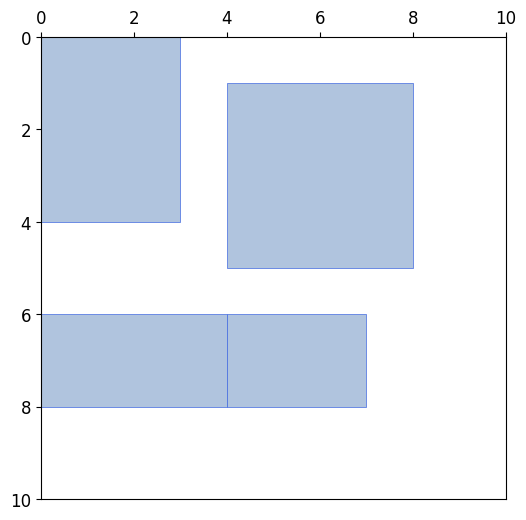
이전 페이지에서 설명한대로 이 코드는 정해진 평면 상에서 네 개의 사각형을 작은 면적을 갖도록 배치합니다.
아래와 같이 사각형이 배치되었습니다.
2) 도형 연결하기
net_info = [(0, 1), (0, 3), (1, 2)]

i = 0
for net in net_info:
    x1, y1, w1, h1 = record_rect_info[net[0]]
    x2, y2, w2, h2 = record_rect_info[net[1]]
    x1, y1 = x1+0.25*(i-1), y1+0.25*(i-1)
    x2, y2 = x2+0.25*(i-1), y2+0.25*(i-1)
    plt.scatter(x1+0.5*w1, y1+0.5*h1, zorder=30, color='C'+str(i))
    plt.scatter(x2+0.5*w2, y2+0.5*h2, zorder=30, color='C'+str(i))
    plt.hlines(y1+0.5*h1, x1+0.5*w1, x2+0.5*w2, colors='gray', lw=5, alpha=0.5)
    plt.vlines(x2+0.5*w2, y1+0.5*h1, y2+0.5*h2, colors='gray', lw=5, alpha=0.5)
    i += 1
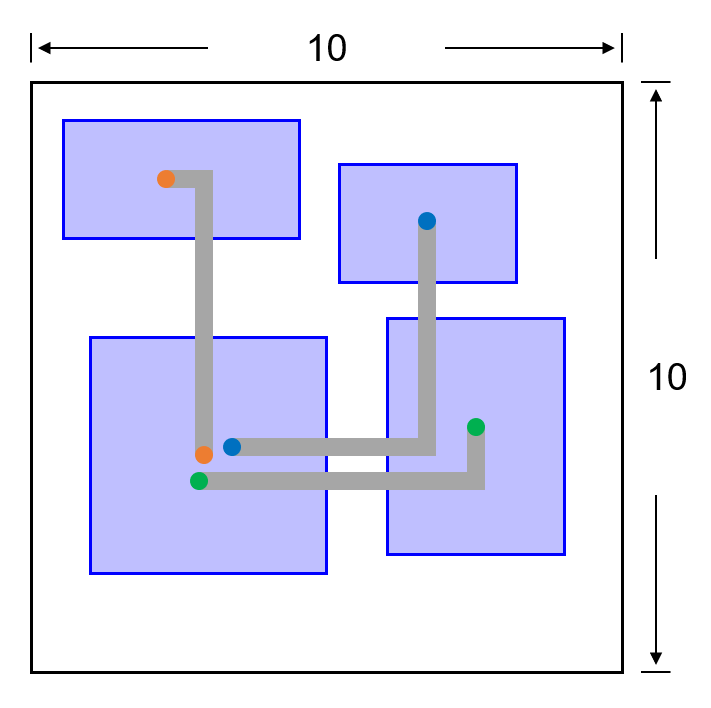
net_info는 사각형 사이의 연결 관계를 지정하는 튜플의 리스트입니다.
(0, 1)은 첫번째-두번째 사각형의 연결을 의미합니다.
matplotlib.pyplot.scatter() 함수를 사용해서 시작 지점과 끝 지점을 표시하고,
matplotlib.pyplot.hlines(), matplotlib.pyplot.hlines() 함수를 사용해서 수평, 수직선으로 사각형을 연결했습니다.
아래와 같은 그림이 나타납니다.
전체 코드는 아래와 같습니다.
import numpy as np
import matplotlib.pyplot as plt
import matplotlib.patches as patches


def draw_rect(canvas, rectangle):
    (x, y, w, h) = rectangle
    canvas[y:y+h, x:x+w] = len(rect_info)


def find_place(canvas, rectangle):
    w_rect, h_rect = rectangle[2], rectangle[3]
    options = []
    for i in range(height - h_rect + 1):
        for j in range(width - w_rect + 1):
            if not np.any(canvas[i:i+h_rect, j:j+w_rect]):
                options.append((j, i))
    rand = np.random.randint(len(options))
    return options[rand]


width, height = 10, 10
new_rect = [[0, 0, 4, 4], [0, 0, 3, 4], [0, 0, 4, 2], [0, 0, 3, 2]]
record_x, record_y = 10, 10
record_rect_info = []
num_episodes = 1000

for n in range(num_episodes):
    canvas1 = np.zeros((height, width))
    rect_info = []
    for rect in new_rect:
        rect[0], rect[1] = find_place(canvas1, rect)
        rect_info.append(tuple(rect))
        draw_rect(canvas1, rect)

    max_x = max(np.array(rect_info)[:, 0] + np.array(rect_info)[:, 2])
    max_y = max(np.array(rect_info)[:, 1] + np.array(rect_info)[:, 3])
    if max_x <= record_x and max_y <= record_y:
        record_rect_info = rect_info
        record_x, record_y = max_x, max_y


plt.style.use('default')
plt.rcParams['figure.figsize'] = (6, 6)
plt.rcParams['font.size'] = 12

fig, ax = plt.subplots()
for (x, y, w, h) in record_rect_info:
    ax.add_patch(
        patches.Rectangle(
            (x, y), w, h,
            edgecolor='royalblue',
            facecolor='lightsteelblue',
            linewidth=0.5,
            fill=True))

ax.axis((0, 10, 10, 0))
ax.xaxis.tick_top()


net_info = [(0, 1), (0, 3), (1, 2)]

i = 0
for net in net_info:
    x1, y1, w1, h1 = record_rect_info[net[0]]
    x2, y2, w2, h2 = record_rect_info[net[1]]
    x1, y1 = x1+0.25*(i-1), y1+0.25*(i-1)
    x2, y2 = x2+0.25*(i-1), y2+0.25*(i-1)
    plt.scatter(x1+0.5*w1, y1+0.5*h1, zorder=30, color='C'+str(i))
    plt.scatter(x2+0.5*w2, y2+0.5*h2, zorder=30, color='C'+str(i))
    plt.hlines(y1+0.5*h1, x1+0.5*w1, x2+0.5*w2, colors='gray', lw=5, alpha=0.5)
    plt.vlines(x2+0.5*w2, y1+0.5*h1, y2+0.5*h2, colors='gray', lw=5, alpha=0.5)
    i += 1

plt.show()