Contents
- Matplotlib Tutorial - 파이썬으로 데이터 시각화하기
- Matplotlib 설치하기
- Matplotlib 기본 사용
- Matplotlib 숫자 입력하기
- Matplotlib 축 레이블 설정하기
- Matplotlib 범례 표시하기
- Matplotlib 축 범위 지정하기
- Matplotlib 선 종류 지정하기
- Matplotlib 마커 지정하기
- Matplotlib 색상 지정하기
- Matplotlib 그래프 영역 채우기
- Matplotlib 축 스케일 지정하기
- Matplotlib 여러 곡선 그리기
- Matplotlib 그리드 설정하기
- Matplotlib 눈금 표시하기
- Matplotlib 타이틀 설정하기
- Matplotlib 수평선/수직선 표시하기
- Matplotlib 막대 그래프 그리기
- Matplotlib 수평 막대 그래프 그리기
- Matplotlib 산점도 그리기
- Matplotlib 3차원 산점도 그리기
- Matplotlib 히스토그램 그리기
- Matplotlib 에러바 표시하기
- Matplotlib 파이 차트 그리기
- Matplotlib 히트맵 그리기
- Matplotlib 여러 개의 그래프 그리기
- Matplotlib 컬러맵 설정하기
- Matplotlib 텍스트 삽입하기
- Matplotlib 수학적 표현 사용하기
- Matplotlib 그래프 스타일 설정하기
- Matplotlib 이미지 저장하기
- Matplotlib 객체 지향 인터페이스 1
- Matplotlib 객체 지향 인터페이스 2
- Matplotlib 축 위치 조절하기
- Matplotlib 이중 Y축 표시하기
- Matplotlib 두 종류의 그래프 그리기
- Matplotlib 박스 플롯 그리기
- Matplotlib 바이올린 플롯 그리기
- Matplotlib 다양한 도형 삽입하기
- Matplotlib 다양한 패턴 채우기
- Matplotlib 애니메이션 사용하기 1
- Matplotlib 애니메이션 사용하기 2
- Matplotlib 3차원 Surface 표현하기
- Matplotlib 트리맵 그리기 (Squarify)
- Matplotlib Inset 그래프 삽입하기
Tutorials
- Python Tutorial
- NumPy Tutorial
- Matplotlib Tutorial
- PyQt5 Tutorial
- BeautifulSoup Tutorial
- xlrd/xlwt Tutorial
- Pillow Tutorial
- Googletrans Tutorial
- PyWin32 Tutorial
- PyAutoGUI Tutorial
- Pyperclip Tutorial
- TensorFlow Tutorial
- Tips and Examples
Matplotlib 애니메이션 사용하기 1
다양한 Matplotlib 그래프를 애니메이션으로 나타내고, 파일로 저장할 수 있습니다.
matplotlib.animation 모듈의 FuncAnimation 클래스를 사용해서 그래프를 애니메이션으로 표현하는 방법에 대해 소개합니다.
■ Table of Contents
1) 기본 사용
예제
import numpy as np
import matplotlib.pyplot as plt
from matplotlib.animation import FuncAnimation

fig, ax = plt.subplots()
ax.set_xlim(0, 2*np.pi)
ax.set_ylim(-1.2, 1.2)

x, y = [], []
line, = plt.plot([], [], 'bo')


def update(frame):
    x.append(frame)
    y.append(np.sin(frame))
    line.set_data(x, y)
    return line,


ani = FuncAnimation(fig, update, frames=np.linspace(0, 2*np.pi, 128))
plt.show()
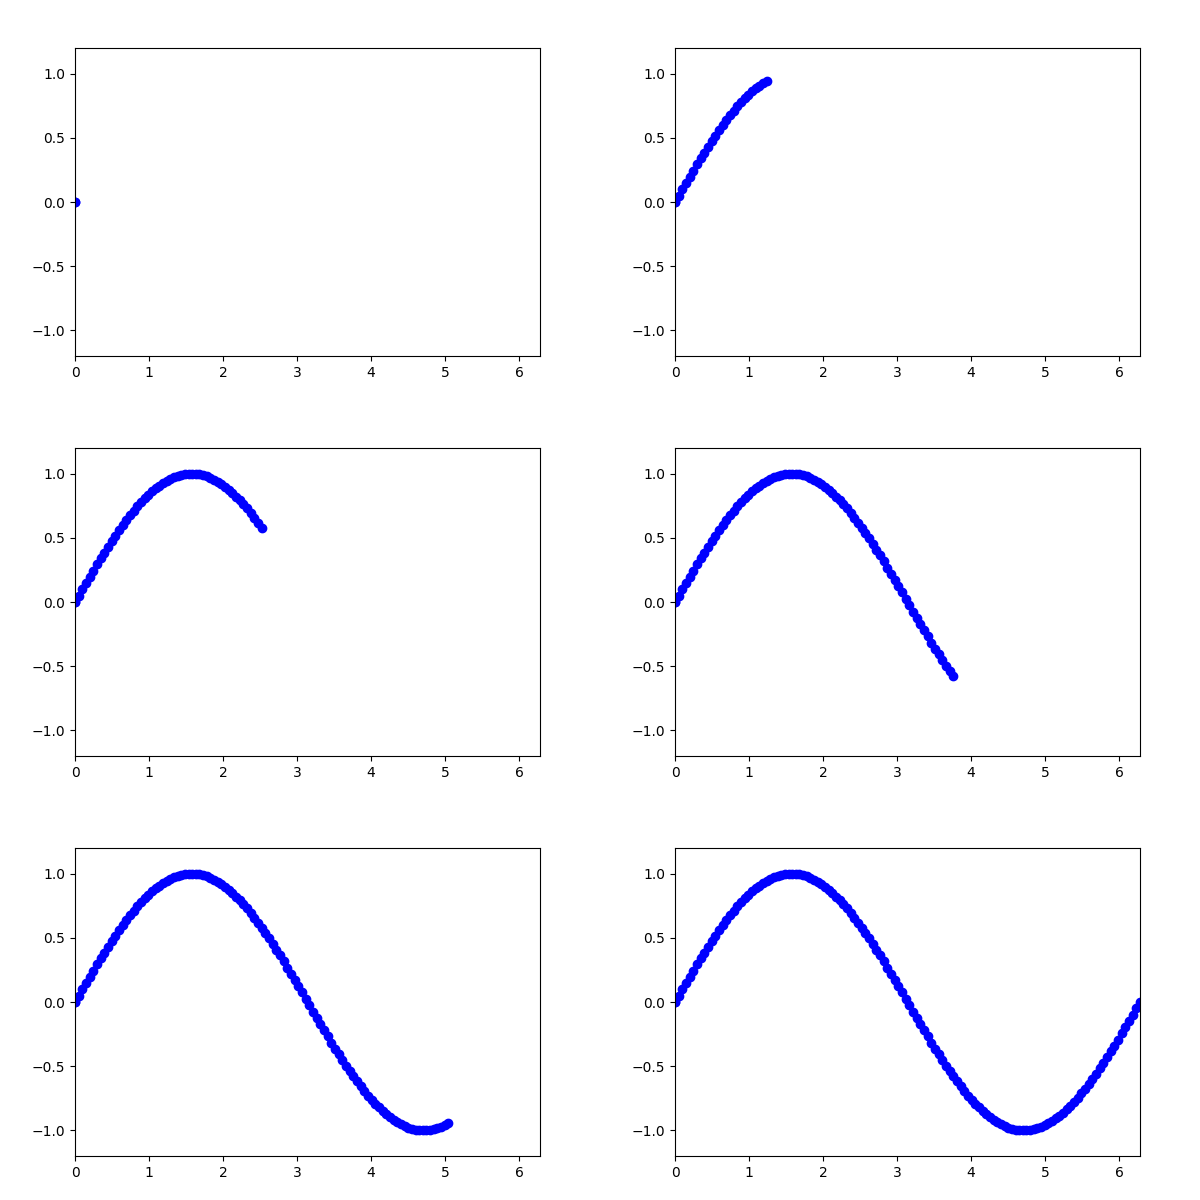
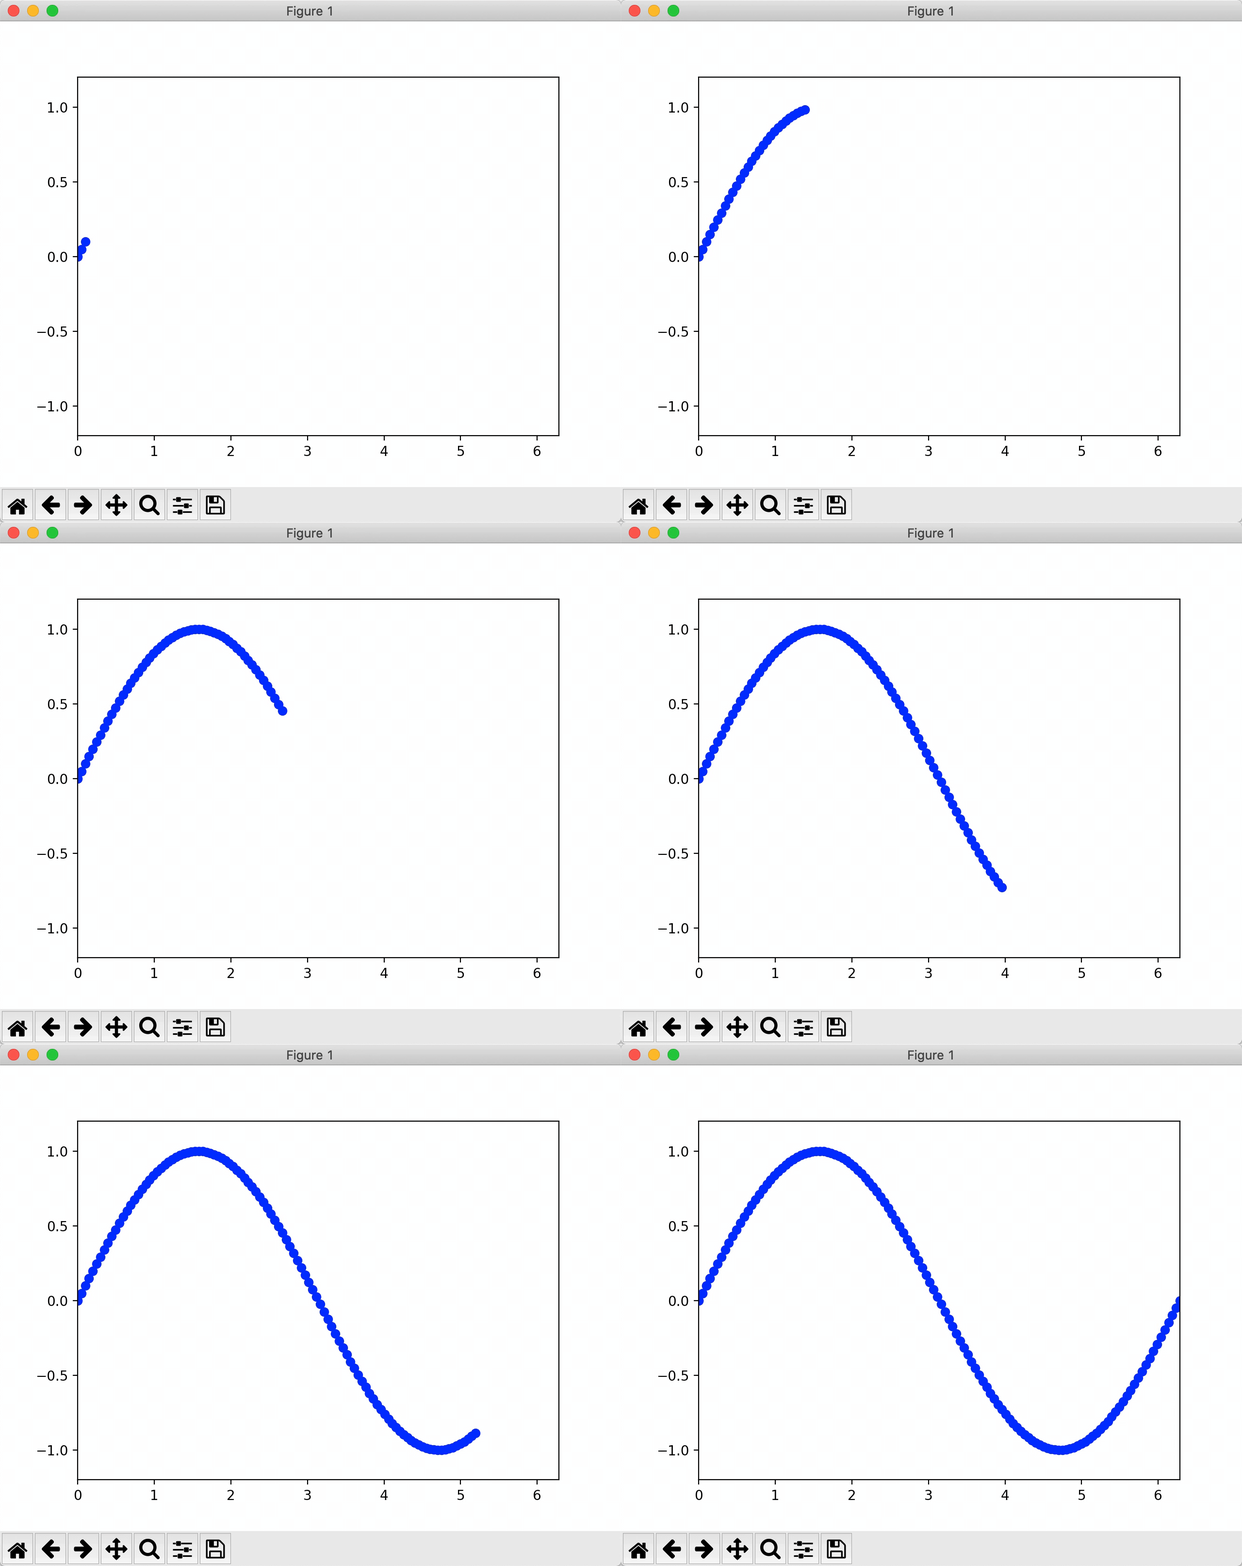
matplotlib.animation 모듈의 FuncAnimation 클래스는 지정한 함수를 반복적으로 호출함으로써 애니메이션을 생성합니다.
FuncAnimation 클래스의 첫번째 인자로 Figure 객체를, 두번째 인자로는 프레임마다 반복해서 호출할 함수를 지정합니다.
frames 키워드 인자에는 반복 가능한 객체를 입력합니다.
np.linspace(a, b, n)는 a부터 b 사이를 균일한 간격으로 나누는 숫자 n개를 반환합니다.
update() 함수에 frames에 제공한 값들이 순서대로 제공되어서 프레임을 구성합니다.
아래와 같은 애니메이션이 나타납니다.
Matplotlib 애니메이션 사용하기 - 기본 사용
2) 프레임 간격 설정하기
예제
import numpy as np
import matplotlib.pyplot as plt
from matplotlib.animation import FuncAnimation

fig = plt.figure()
ax = plt.axes(xlim=(0, 4), ylim=(-2, 2))
line, = ax.plot([], [], lw=3)


def animate(i):
  x = np.linspace(0, 4, 1000)
  y = np.sin(2 * np.pi * (x - 0.01 * i))
  line.set_data(x, y)
  return line,


# anim = FuncAnimation(fig, animate, frames=200, interval=50)
anim = FuncAnimation(fig, animate, frames=200, interval=100)

plt.show()
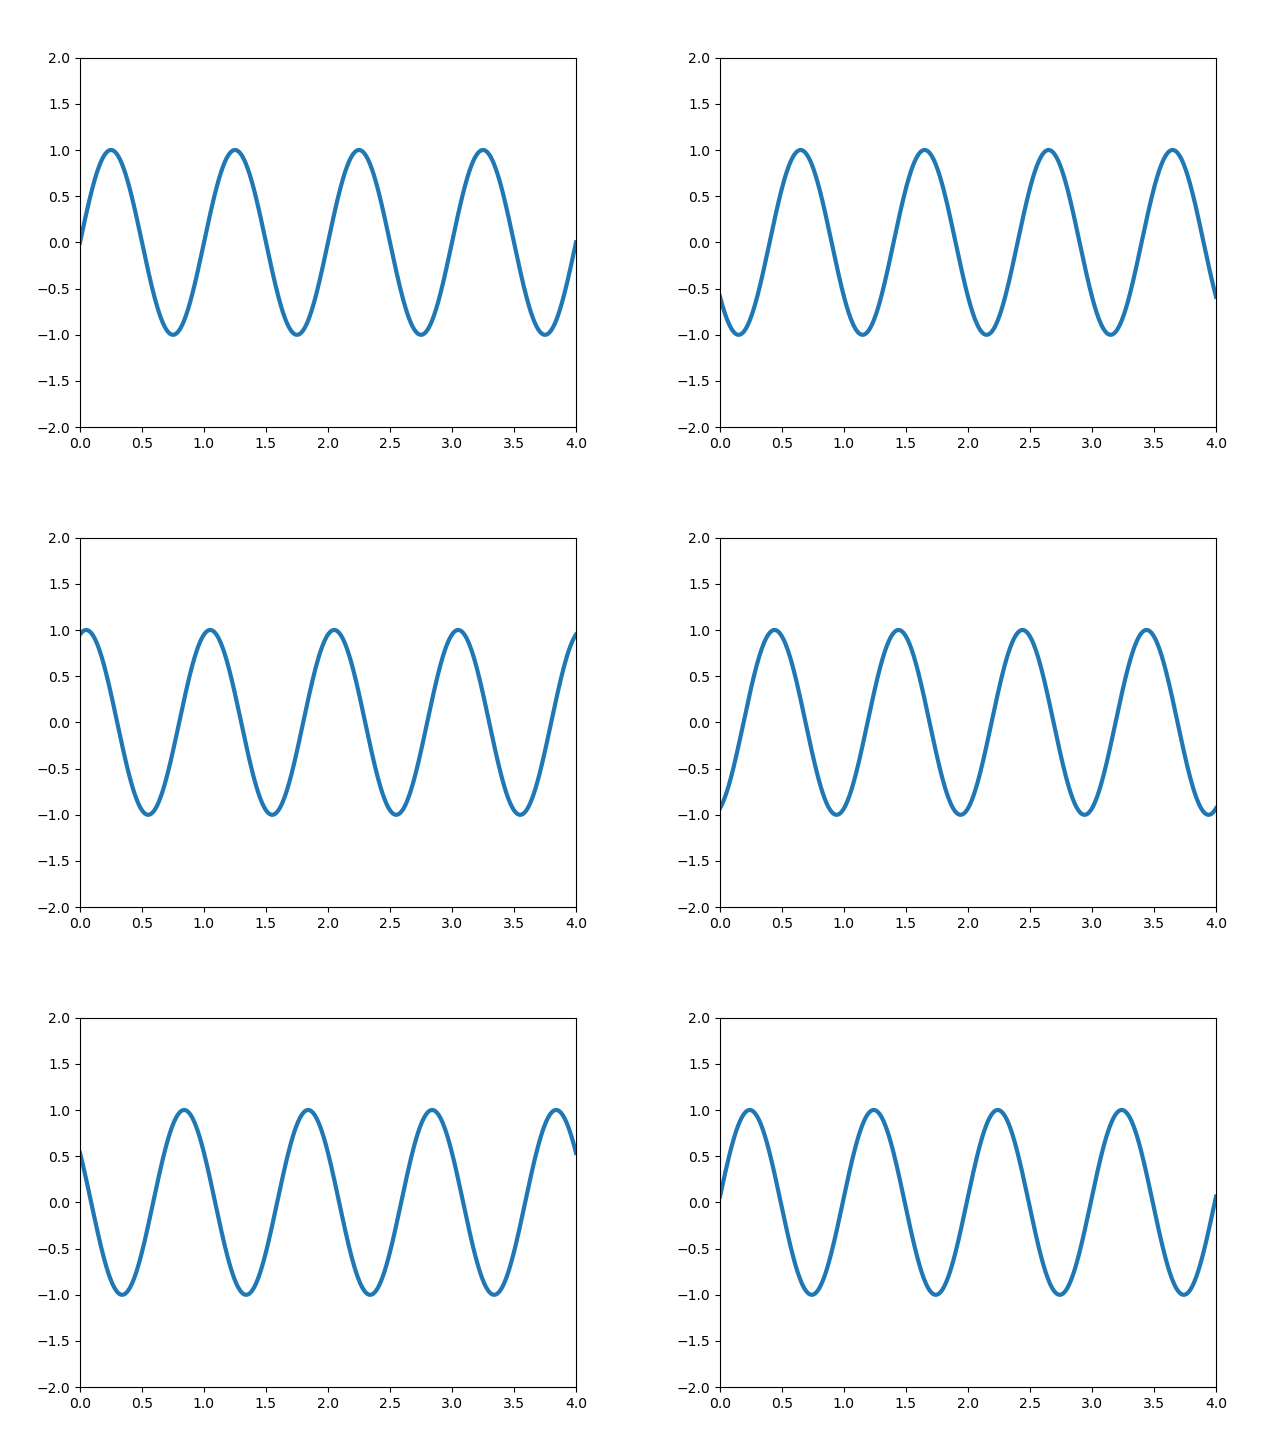
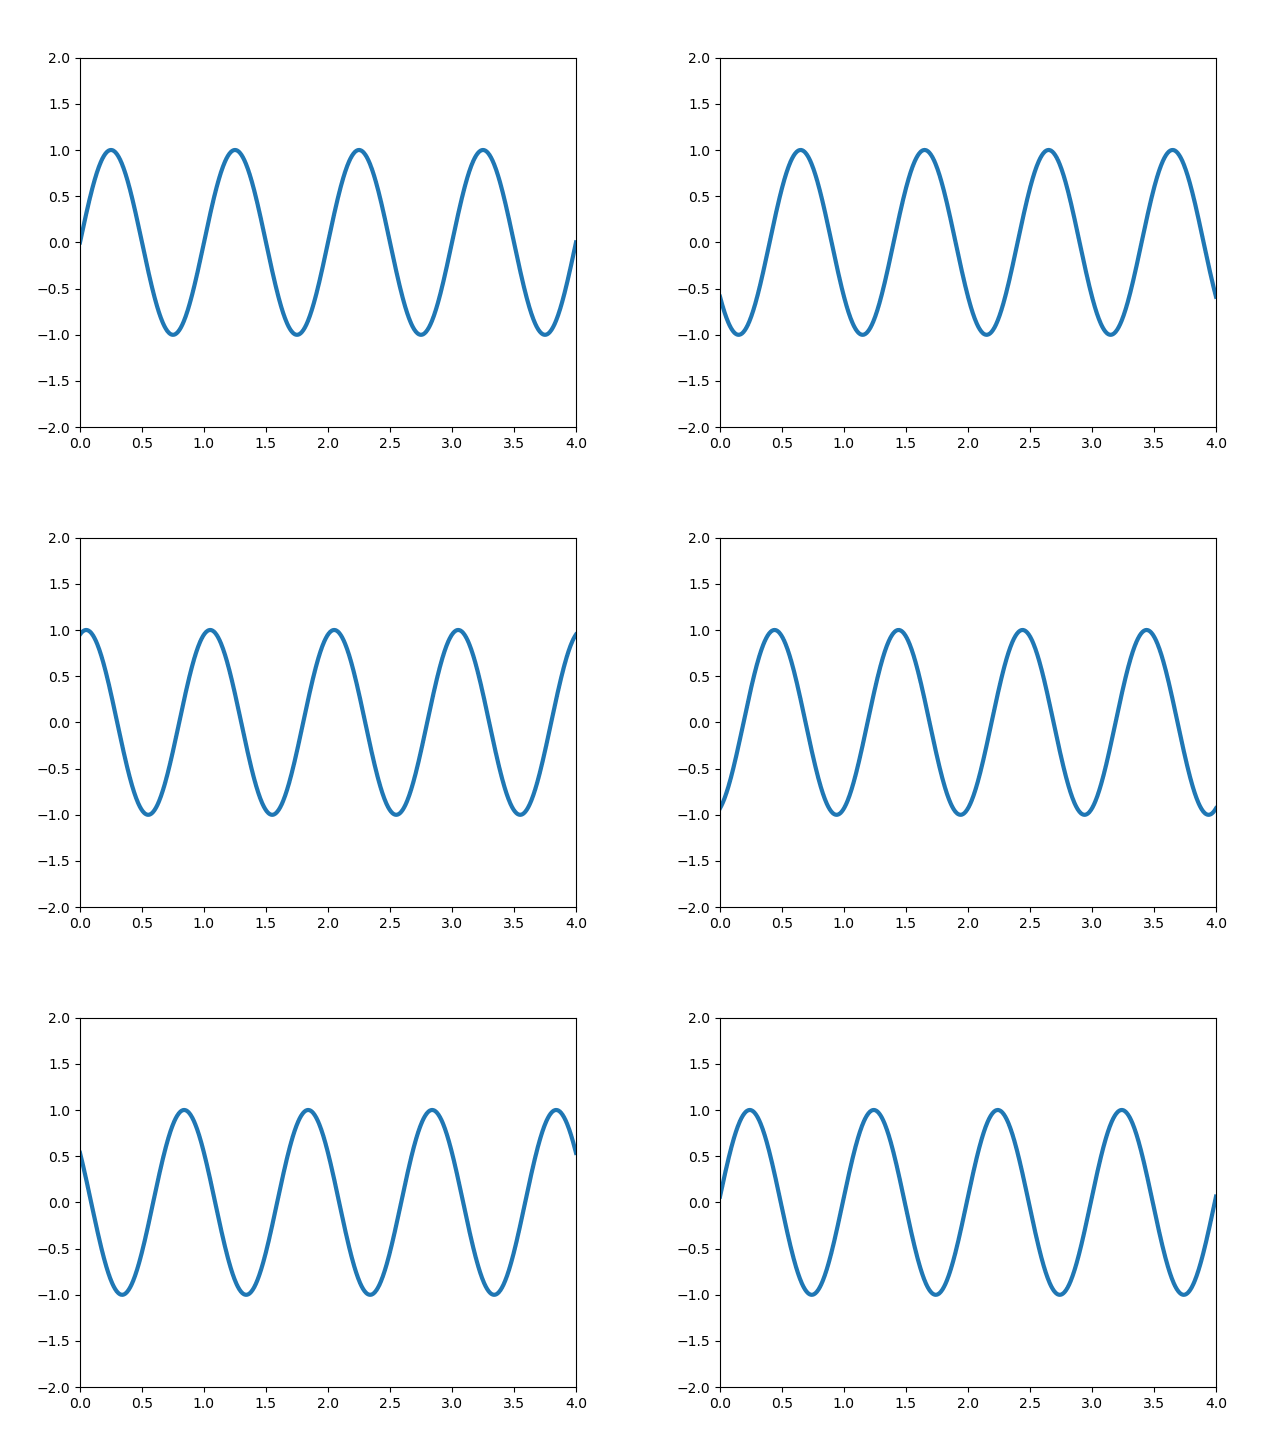
FuncAnimation 클래스의 interval을 사용해서 프레임 사이의 간격을 밀리초 (milliseconds) 단위로 지정할 수 있습니다.
디폴트 값은 200이며, 예제에서는 interval 값을 각각 50, 100으로 지정했습니다.
아래와 같은 애니메이션 그래프가 나타납니다.
Matplotlib 애니메이션 사용하기 - Interval 설정하기 (interval=50ms)
Matplotlib 애니메이션 사용하기 - Interval 설정하기 (interval=100ms)
3) 애니메이션 저장하기
예제
import numpy as np
import matplotlib.pyplot as plt
from matplotlib.animation import FuncAnimation

fig = plt.figure()
ax = plt.axes(xlim=(0, 4), ylim=(-2, 2))
line, = ax.plot([], [], lw=3)


def animate(i):
    x = np.linspace(0, 4, 1000)
    y = np.sin(2 * np.pi * (x - 0.01 * i))
    line.set_data(x, y)
    return line,


# anim = FuncAnimation(fig, animate, frames=200, interval=50)
anim = FuncAnimation(fig, animate, frames=200, interval=100)

# plt.show()
# anim.save('sine_wave_interval_50ms.gif', writer='imagemagick')
anim.save('sine_wave_interval_100ms.gif', writer='imagemagick')
matplotlib.animation 모듈의 FuncAnimation 클래스의 save() 메서드는 모든 프레임을 애니메이션으로 저장합니다.
Matplotlib 애니메이션을 저장하기 위해서 ImageMagick을 사용합니다.
Windows 환경에서는 아래 그림의 파일을 다운받아서 실행하면 설치가 진행됩니다.
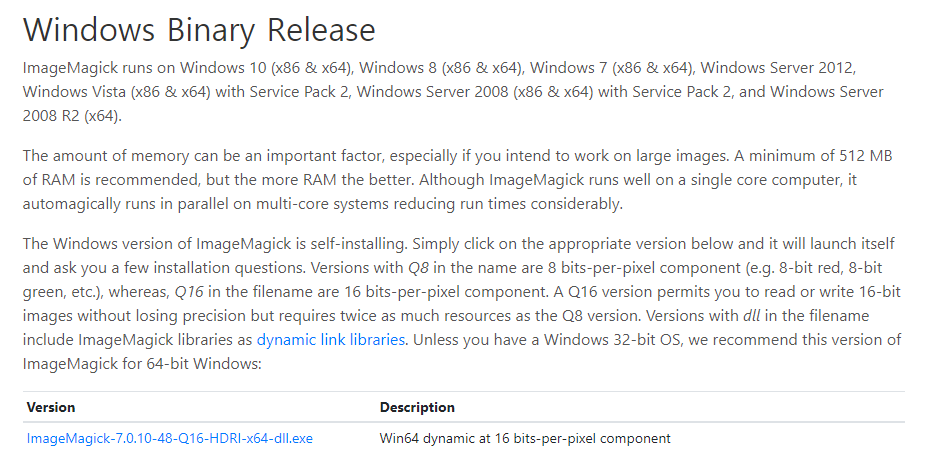
Matplotlib 애니메이션 사용하기 - ImageMagick 설치하기
Ubuntu 환경 (Google Colaboratory)에서는 아래의 명령어로 ImageMagick을 설치할 수 있습니다.
!apt install imagemagick
save() 메서드에 writer=’imagemagick’과 같이 지정해주고, save() 메서드를 호출하면 지정한 파일명의 .gif 파일이 지정한 경로에 저장됩니다.
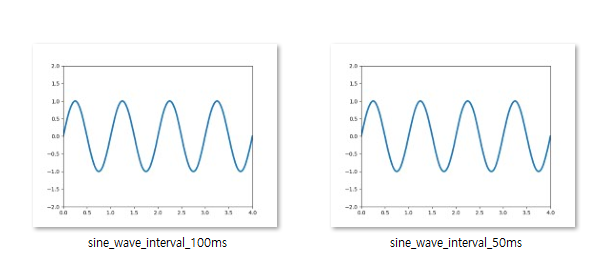
Matplotlib 애니메이션 사용하기 - 애니메이션 저장하기
