Contents
- Matplotlib Tutorial - 파이썬으로 데이터 시각화하기
- Matplotlib 설치하기
- Matplotlib 기본 사용
- Matplotlib 숫자 입력하기
- Matplotlib 축 레이블 설정하기
- Matplotlib 범례 표시하기
- Matplotlib 축 범위 지정하기
- Matplotlib 선 종류 지정하기
- Matplotlib 마커 지정하기
- Matplotlib 색상 지정하기
- Matplotlib 그래프 영역 채우기
- Matplotlib 축 스케일 지정하기
- Matplotlib 여러 곡선 그리기
- Matplotlib 그리드 설정하기
- Matplotlib 눈금 표시하기
- Matplotlib 타이틀 설정하기
- Matplotlib 수평선/수직선 표시하기
- Matplotlib 막대 그래프 그리기
- Matplotlib 수평 막대 그래프 그리기
- Matplotlib 산점도 그리기
- Matplotlib 3차원 산점도 그리기
- Matplotlib 히스토그램 그리기
- Matplotlib 에러바 표시하기
- Matplotlib 파이 차트 그리기
- Matplotlib 히트맵 그리기
- Matplotlib 여러 개의 그래프 그리기
- Matplotlib 컬러맵 설정하기
- Matplotlib 텍스트 삽입하기
- Matplotlib 수학적 표현 사용하기
- Matplotlib 그래프 스타일 설정하기
- Matplotlib 이미지 저장하기
- Matplotlib 객체 지향 인터페이스 1
- Matplotlib 객체 지향 인터페이스 2
- Matplotlib 축 위치 조절하기
- Matplotlib 이중 Y축 표시하기
- Matplotlib 두 종류의 그래프 그리기
- Matplotlib 박스 플롯 그리기
- Matplotlib 바이올린 플롯 그리기
- Matplotlib 다양한 도형 삽입하기
- Matplotlib 다양한 패턴 채우기
- Matplotlib 애니메이션 사용하기 1
- Matplotlib 애니메이션 사용하기 2
- Matplotlib 3차원 Surface 표현하기
- Matplotlib 트리맵 그리기 (Squarify)
- Matplotlib Inset 그래프 삽입하기
Tutorials
- Python Tutorial
- NumPy Tutorial
- Matplotlib Tutorial
- PyQt5 Tutorial
- BeautifulSoup Tutorial
- xlrd/xlwt Tutorial
- Pillow Tutorial
- Googletrans Tutorial
- PyWin32 Tutorial
- PyAutoGUI Tutorial
- Pyperclip Tutorial
- TensorFlow Tutorial
- Tips and Examples
Matplotlib 그래프 스타일 설정하기
Matplotlib 그래프의 스타일을 간단하게 설정하는 방법을 소개합니다.
Matplotlib의 스타일 파라미터 rcParams를 사용해서 그래프를 커스터마이즈할 수 있습니다.
■ Table of Contents
1) 기본 사용
예제
import matplotlib.pyplot as plt
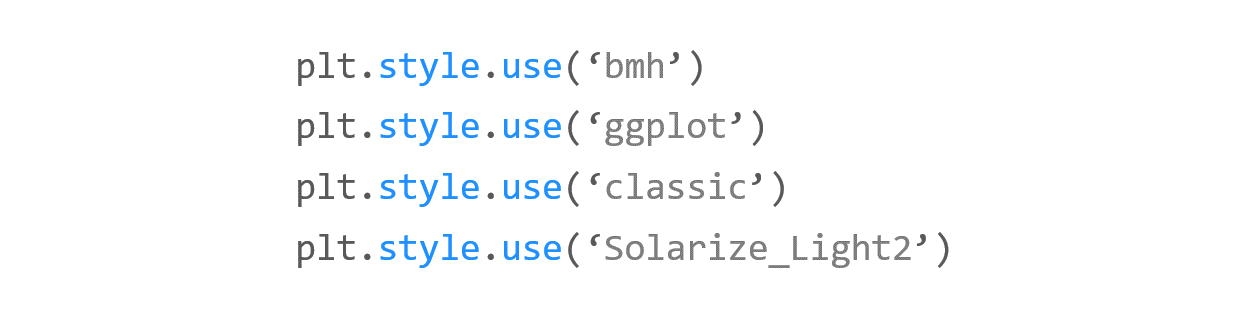
plt.style.use('bmh')
# plt.style.use('ggplot')
# plt.style.use('classic')
# plt.style.use('Solarize_Light2')
# plt.style.use('default')
plt.plot([1, 2, 3, 4], [4, 6, 2, 7])
plt.show()
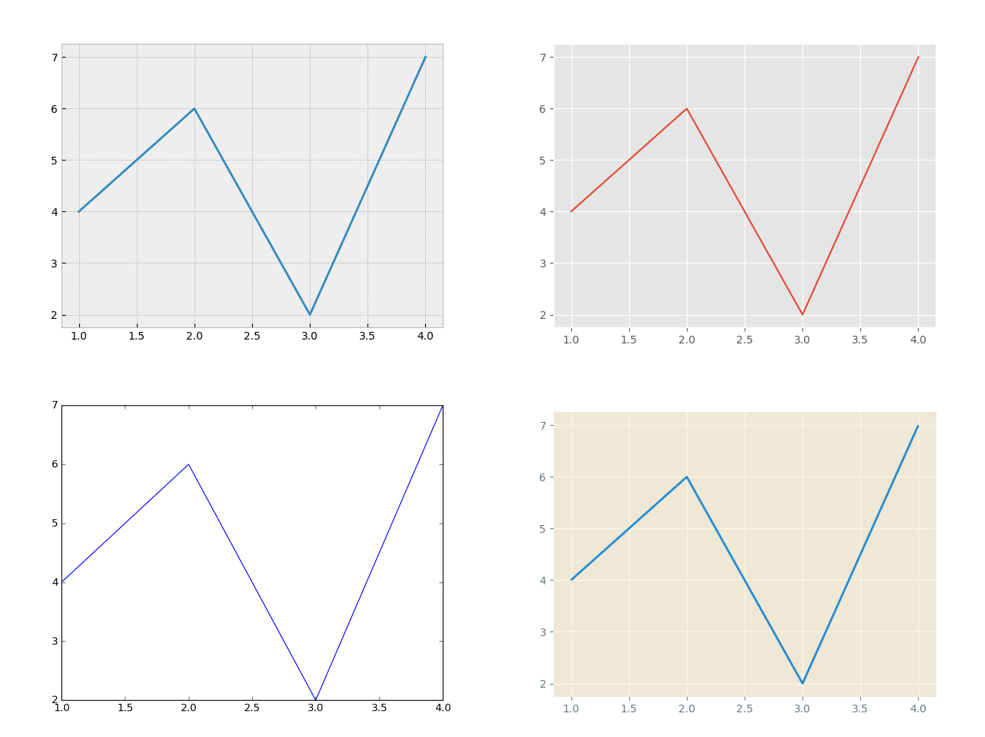
matplotlib.style 모듈은 미리 만들어놓은 Matplotlib 그래프 스타일을 포함하고 있습니다.
matplotlib.style.use()를 사용해서 다양한 스타일을 지정할 수 있습니다.
예제에서는 ‘bmh’, ‘ggplot’, ‘classic’, ‘Solarize_Light2’ 네 가지의 스타일을 지정했습니다.
다시 기본 스타일로 돌아가기 위해서는 plt.style.use(‘default’)를 호출하면 됩니다.
Matplotlib 그래프 스타일 설정하기 - 기본 사용
사용할 수 있는 Matplotlib 스타일을 확인하기 위해서는 아래의 코드를 실행하세요.
import matplotlib.pyplot as plt

print(plt.style.available)
['Solarize_Light2', '_classic_test_patch', 'bmh', 'classic', 'dark_background', 'fast', 'fivethirtyeight', 'ggplot', 'grayscale', 'seaborn', 'seaborn-bright', 'seaborn-colorblind', 'seaborn-dark', 'seaborn-dark-palette', 'seaborn-darkgrid', 'seaborn-deep', 'seaborn-muted', 'seaborn-notebook', 'seaborn-paper', 'seaborn-pastel', 'seaborn-poster', 'seaborn-talk', 'seaborn-ticks', 'seaborn-white', 'seaborn-whitegrid', 'tableau-colorblind10']
2) rcParams 사용하기

예제1
import matplotlib.pyplot as plt

plt.style.use('default')
plt.rcParams['figure.figsize'] = (6, 3)
plt.rcParams['font.size'] = 12
# plt.rcParams['figure.figsize'] = (4, 3)
# plt.rcParams['font.size'] = 14

plt.plot([1, 2, 3, 4], [4, 6, 2, 7])
plt.show()
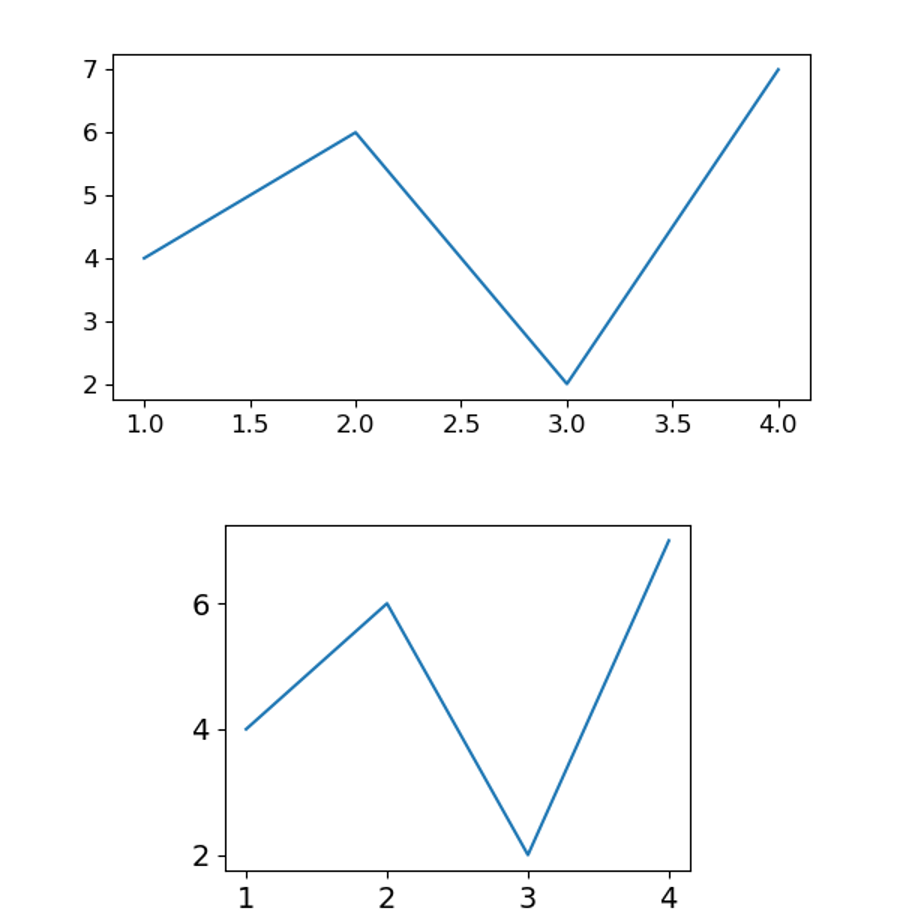
미리 지정해놓은 스타일을 사용하지 않고, 각각의 스타일 관련 파라미터 (rcParams)를 지정할 수 있습니다.
‘figure.figsize’를 사용해서 그래프 이미지의 크기를 (6, 3)과 (4, 3)으로,
‘font.size’를 사용해서 폰트의 크기를 12와 14로 각각 지정했습니다.
아래의 두 그래프를 얻을 수 있습니다.
Matplotlib 그래프 스타일 설정하기 - rcParams 사용하기 1
예제2
import matplotlib.pyplot as plt

plt.style.use('default')
plt.rcParams['lines.linewidth'] = 3
plt.rcParams['lines.linestyle'] = '-'
# plt.rcParams['lines.linewidth'] = 5
# plt.rcParams['lines.linestyle'] = '--'

plt.plot([1, 2, 3, 4], [4, 6, 2, 7])
plt.show()
이번에는 ‘lines.linewidth’를 사용해서 선의 두께를 3과 5로,
‘lines.linestyle’를 사용해서 선의 스타일을 ‘-‘과 ‘- -‘로 지정했습니다.
아래와 같은 그래프가 나타납니다.
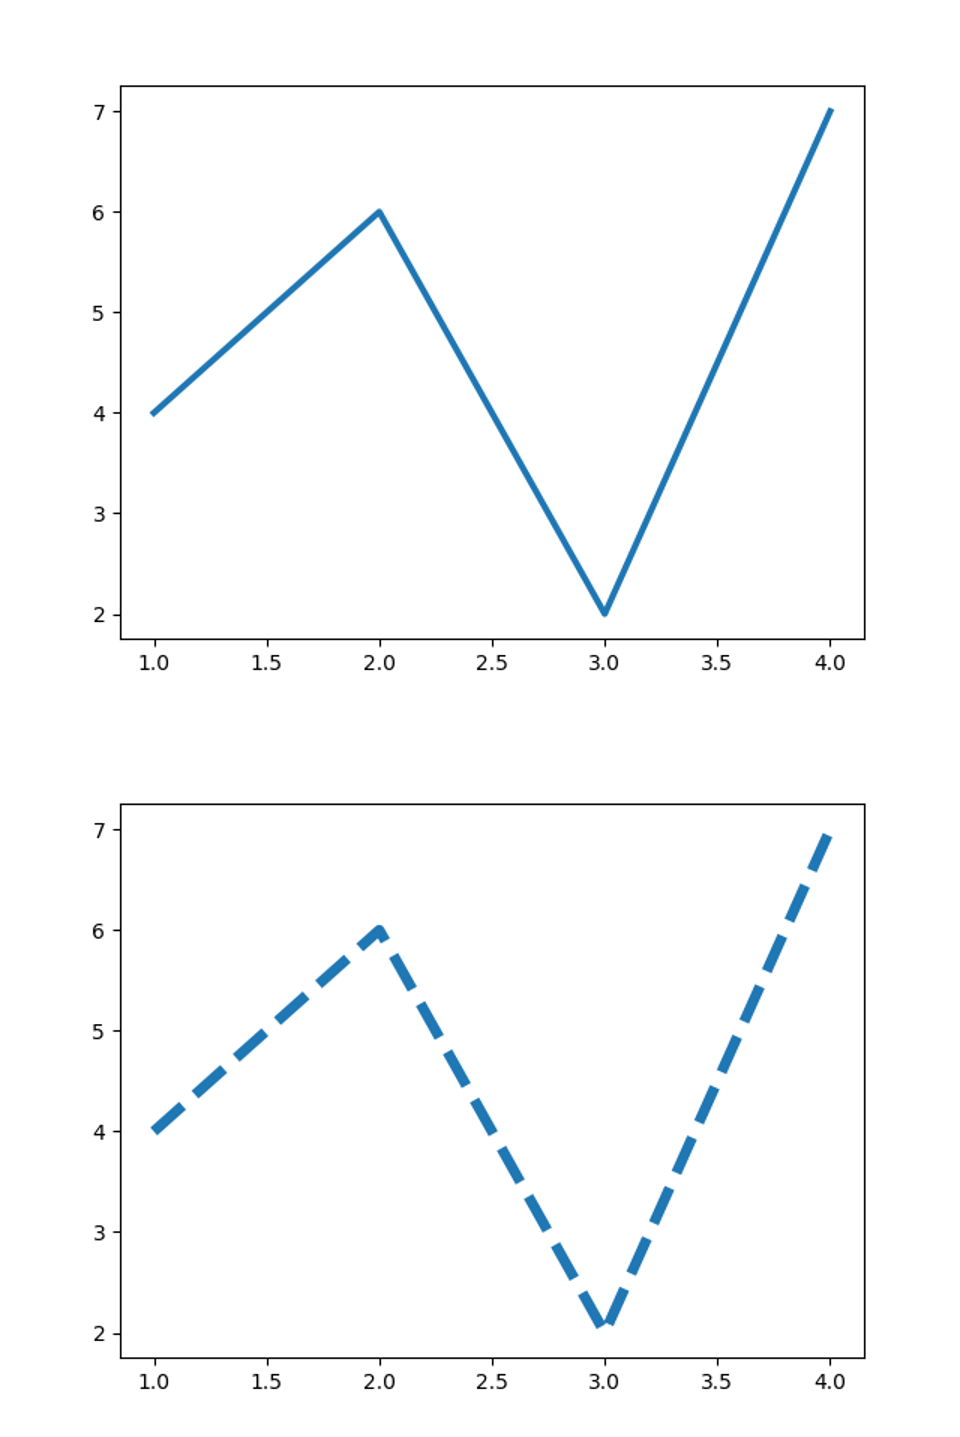
Matplotlib 그래프 스타일 설정하기 - rcParams 사용하기 2
예제3
import matplotlib.pyplot as plt
plt.style.use('default')
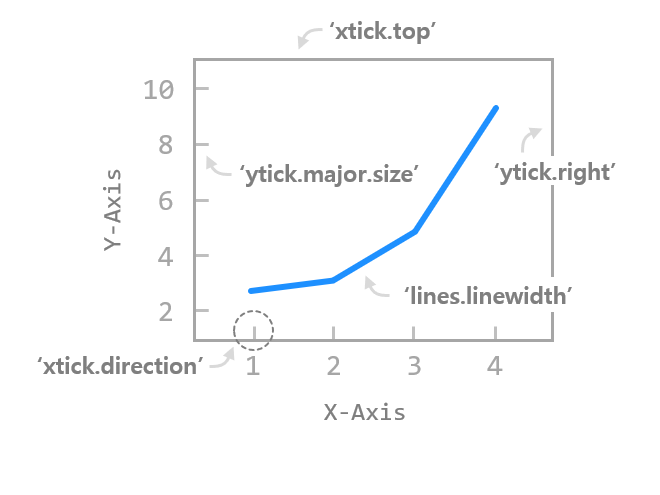
plt.rcParams['xtick.top'] = True
plt.rcParams['ytick.right'] = True
plt.rcParams['xtick.direction'] = 'in'
plt.rcParams['ytick.direction'] = 'in'
# plt.rcParams['xtick.major.size'] = 7
# plt.rcParams['ytick.major.size'] = 7
# plt.rcParams['xtick.minor.visible'] = True
# plt.rcParams['ytick.minor.visible'] = True
plt.plot([1, 2, 3, 4], [4, 6, 2, 7])
plt.show()
축 눈금과 관련된 rcParams을 설정했습니다.
‘xtick.top’, ‘ytick.right’을 True로 설정하면 데이터 영역의 위, 오른쪽에 눈금이 표시됩니다.
‘xtick.direction’, ytick.direction’은 눈금이 표시될 방향이며, {‘in’, ‘out’, ‘inout’} 중 선택할 수 있습니다.
‘xtick.major.size’, ytick.major.size’는 주 눈금의 크기 (길이)를 지정합니다.
‘xtick.minor.visible’, ytick.minor.visible’을 True로 설정하면 보조 눈금이 함께 표시됩니다.
결과는 아래와 같습니다.
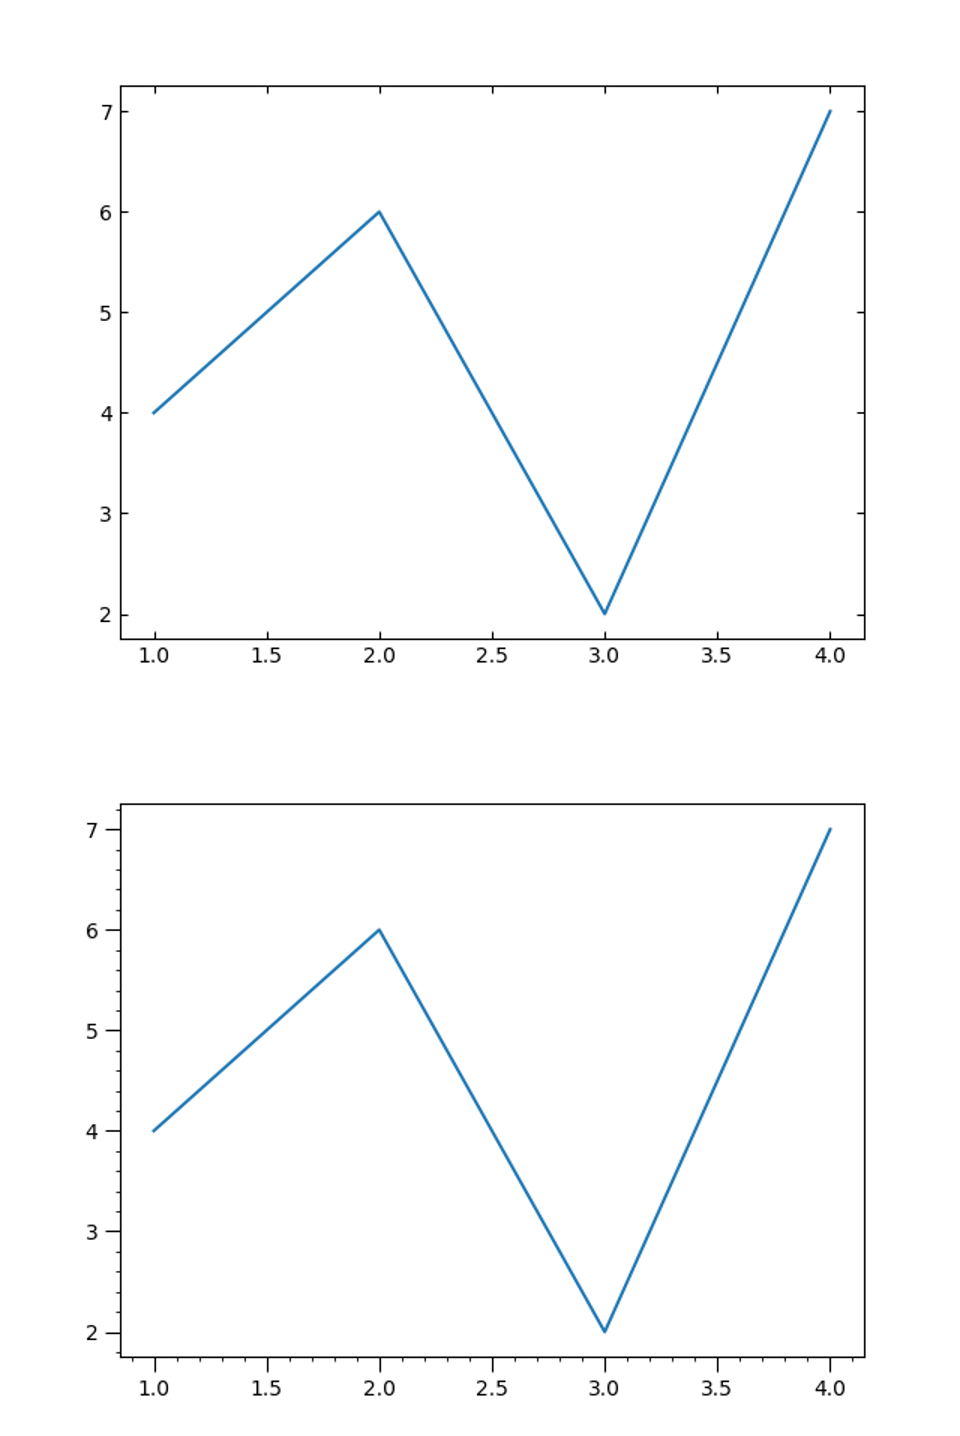
Matplotlib 그래프 스타일 설정하기 - rcParams 사용하기 3
더 많은 rcParams은 아래의 리스트를 참고하세요.
#### MATPLOTLIBRC FORMAT
## NOTE FOR END USERS: DO NOT EDIT THIS FILE!
##
## This is a sample matplotlib configuration file - you can find a copy
## of it on your system in site-packages/matplotlib/mpl-data/matplotlibrc
## (which related to your Python installation location).
##
## You should find a copy of it on your system at
## site-packages/matplotlib/mpl-data/matplotlibrc (relative to your Python
## installation location). DO NOT EDIT IT!
##
## If you wish to change your default style, copy this file to one of the
## following locations
## unix/linux:
## $HOME/.config/matplotlib/matplotlibrc OR
## $XDG_CONFIG_HOME/matplotlib/matplotlibrc (if $XDG_CONFIG_HOME is set)
## other platforms:
## $HOME/.matplotlib/matplotlibrc
## and edit that copy.
##
## See https://matplotlib.org/users/customizing.html#the-matplotlibrc-file
## for more details on the paths which are checked for the configuration file.
##
## Blank lines, or lines starting with a comment symbol, are ignored, as are
## trailing comments. Other lines must have the format:
## key: val # optional comment
##
## Formatting: Use PEP8-like style (as enforced in the rest of the codebase).
## All lines start with an additional '#', so that removing all leading '#'s
## yields a valid style file.
##
## Colors: for the color values below, you can either use
## - a matplotlib color string, such as r, k, or b
## - an rgb tuple, such as (1.0, 0.5, 0.0)
## - a hex string, such as ff00ff
## - a scalar grayscale intensity such as 0.75
## - a legal html color name, e.g., red, blue, darkslategray
##
## Matplotlib configuration are currently divided into following parts:
## - BACKENDS
## - LINES
## - PATCHES
## - HATCHES
## - BOXPLOT
## - FONT
## - TEXT
## - LaTeX
## - AXES
## - DATES
## - TICKS
## - GRIDS
## - LEGEND
## - FIGURE
## - IMAGES
## - CONTOUR PLOTS
## - ERRORBAR PLOTS
## - HISTOGRAM PLOTS
## - SCATTER PLOTS
## - AGG RENDERING
## - PATHS
## - SAVING FIGURES
## - INTERACTIVE KEYMAPS
## - ANIMATION
##### CONFIGURATION BEGINS HERE
## ***************************************************************************
## * BACKENDS *
## ***************************************************************************
## The default backend. If you omit this parameter, the first working
## backend from the following list is used:
## MacOSX Qt5Agg Gtk3Agg TkAgg WxAgg Agg
## Other choices include:
## Qt5Cairo GTK3Cairo TkCairo WxCairo Cairo
## Qt4Agg Qt4Cairo Wx # deprecated.
## PS PDF SVG Template
## You can also deploy your own backend outside of matplotlib by referring to
## the module name (which must be in the PYTHONPATH) as 'module://my_backend'.
#backend: Agg
## The port to use for the web server in the WebAgg backend.
#webagg.port: 8988
## The address on which the WebAgg web server should be reachable
#webagg.address: 127.0.0.1
## If webagg.port is unavailable, a number of other random ports will
## be tried until one that is available is found.
#webagg.port_retries: 50
## When True, open the webbrowser to the plot that is shown
#webagg.open_in_browser: True
## If you are running pyplot inside a GUI and your backend choice
## conflicts, we will automatically try to find a compatible one for
## you if backend_fallback is True
#backend_fallback: True
#interactive: False
#toolbar: toolbar2 # {None, toolbar2, toolmanager}
#timezone: UTC # a pytz timezone string, e.g., US/Central or Europe/Paris
## ***************************************************************************
## * LINES *
## ***************************************************************************
## See https://matplotlib.org/api/artist_api.html#module-matplotlib.lines
## for more information on line properties.
#lines.linewidth: 1.5 # line width in points
#lines.linestyle: - # solid line
#lines.color: C0 # has no affect on plot(); see axes.prop_cycle
#lines.marker: None # the default marker
#lines.markerfacecolor: auto # the default marker face color
#lines.markeredgecolor: auto # the default marker edge color
#lines.markeredgewidth: 1.0 # the line width around the marker symbol
#lines.markersize: 6 # marker size, in points
#lines.dash_joinstyle: round # {miter, round, bevel}
#lines.dash_capstyle: butt # {butt, round, projecting}
#lines.solid_joinstyle: round # {miter, round, bevel}
#lines.solid_capstyle: projecting # {butt, round, projecting}
#lines.antialiased: True # render lines in antialiased (no jaggies)
## The three standard dash patterns. These are scaled by the linewidth.
#lines.dashed_pattern: 3.7, 1.6
#lines.dashdot_pattern: 6.4, 1.6, 1, 1.6
#lines.dotted_pattern: 1, 1.65
#lines.scale_dashes: True
#markers.fillstyle: full # {full, left, right, bottom, top, none}
#pcolor.shading : flat
## ***************************************************************************
## * PATCHES *
## ***************************************************************************
## Patches are graphical objects that fill 2D space, like polygons or circles.
## See https://matplotlib.org/api/artist_api.html#module-matplotlib.patches
## for more information on patch properties.
#patch.linewidth: 1 # edge width in points.
#patch.facecolor: C0
#patch.edgecolor: black # if forced, or patch is not filled
#patch.force_edgecolor: False # True to always use edgecolor
#patch.antialiased: True # render patches in antialiased (no jaggies)
## ***************************************************************************
## * HATCHES *
## ***************************************************************************
#hatch.color: black
#hatch.linewidth: 1.0
## ***************************************************************************
## * BOXPLOT *
## ***************************************************************************
#boxplot.notch: False
#boxplot.vertical: True
#boxplot.whiskers: 1.5
#boxplot.bootstrap: None
#boxplot.patchartist: False
#boxplot.showmeans: False
#boxplot.showcaps: True
#boxplot.showbox: True
#boxplot.showfliers: True
#boxplot.meanline: False
#boxplot.flierprops.color: black
#boxplot.flierprops.marker: o
#boxplot.flierprops.markerfacecolor: none
#boxplot.flierprops.markeredgecolor: black
#boxplot.flierprops.markeredgewidth: 1.0
#boxplot.flierprops.markersize: 6
#boxplot.flierprops.linestyle: none
#boxplot.flierprops.linewidth: 1.0
#boxplot.boxprops.color: black
#boxplot.boxprops.linewidth: 1.0
#boxplot.boxprops.linestyle: -
#boxplot.whiskerprops.color: black
#boxplot.whiskerprops.linewidth: 1.0
#boxplot.whiskerprops.linestyle: -
#boxplot.capprops.color: black
#boxplot.capprops.linewidth: 1.0
#boxplot.capprops.linestyle: -
#boxplot.medianprops.color: C1
#boxplot.medianprops.linewidth: 1.0
#boxplot.medianprops.linestyle: -
#boxplot.meanprops.color: C2
#boxplot.meanprops.marker: ^
#boxplot.meanprops.markerfacecolor: C2
#boxplot.meanprops.markeredgecolor: C2
#boxplot.meanprops.markersize: 6
#boxplot.meanprops.linestyle: --
#boxplot.meanprops.linewidth: 1.0
## ***************************************************************************
## * FONT *
## ***************************************************************************
## The font properties used by `text.Text`.
## See https://matplotlib.org/api/font_manager_api.html for more information
## on font properties. The 6 font properties used for font matching are
## given below with their default values.
##
## The font.family property has five values:
## - 'serif' (e.g., Times),
## - 'sans-serif' (e.g., Helvetica),
## - 'cursive' (e.g., Zapf-Chancery),
## - 'fantasy' (e.g., Western), and
## - 'monospace' (e.g., Courier).
## Each of these font families has a default list of font names in decreasing
## order of priority associated with them. When text.usetex is False,
## font.family may also be one or more concrete font names.
##
## The font.style property has three values: normal (or roman), italic
## or oblique. The oblique style will be used for italic, if it is not
## present.
##
## The font.variant property has two values: normal or small-caps. For
## TrueType fonts, which are scalable fonts, small-caps is equivalent
## to using a font size of 'smaller', or about 83%% of the current font
## size.
##
## The font.weight property has effectively 13 values: normal, bold,
## bolder, lighter, 100, 200, 300, ..., 900. Normal is the same as
## 400, and bold is 700. bolder and lighter are relative values with
## respect to the current weight.
##
## The font.stretch property has 11 values: ultra-condensed,
## extra-condensed, condensed, semi-condensed, normal, semi-expanded,
## expanded, extra-expanded, ultra-expanded, wider, and narrower. This
## property is not currently implemented.
##
## The font.size property is the default font size for text, given in pts.
## 10 pt is the standard value.
##
## Note that font.size controls default text sizes. To configure
## special text sizes tick labels, axes, labels, title, etc, see the rc
## settings for axes and ticks. Special text sizes can be defined
## relative to font.size, using the following values: xx-small, x-small,
## small, medium, large, x-large, xx-large, larger, or smaller
#font.family: sans-serif
#font.style: normal
#font.variant: normal
#font.weight: normal
#font.stretch: normal
#font.size: 10.0
#font.serif: DejaVu Serif, Bitstream Vera Serif, Computer Modern Roman, New Century Schoolbook, Century Schoolbook L, Utopia, ITC Bookman, Bookman, Nimbus Roman No9 L, Times New Roman, Times, Palatino, Charter, serif
#font.sans-serif: DejaVu Sans, Bitstream Vera Sans, Computer Modern Sans Serif, Lucida Grande, Verdana, Geneva, Lucid, Arial, Helvetica, Avant Garde, sans-serif
#font.cursive: Apple Chancery, Textile, Zapf Chancery, Sand, Script MT, Felipa, cursive
#font.fantasy: Comic Neue, Comic Sans MS, Chicago, Charcoal, ImpactWestern, Humor Sans, xkcd, fantasy
#font.monospace: DejaVu Sans Mono, Bitstream Vera Sans Mono, Computer Modern Typewriter, Andale Mono, Nimbus Mono L, Courier New, Courier, Fixed, Terminal, monospace
## ***************************************************************************
## * TEXT *
## ***************************************************************************
## The text properties used by `text.Text`.
## See https://matplotlib.org/api/artist_api.html#module-matplotlib.text
## for more information on text properties
#text.color: black
## ***************************************************************************
## * LaTeX *
## ***************************************************************************
## For more information on LaTex properties, see
## https://matplotlib.org/tutorials/text/usetex.html
#text.usetex: False # use latex for all text handling. The following fonts
# are supported through the usual rc parameter settings:
# new century schoolbook, bookman, times, palatino,
# zapf chancery, charter, serif, sans-serif, helvetica,
# avant garde, courier, monospace, computer modern roman,
# computer modern sans serif, computer modern typewriter
# If another font is desired which can loaded using the
# LaTeX \usepackage command, please inquire at the
# matplotlib mailing list
#text.latex.preamble: # IMPROPER USE OF THIS FEATURE WILL LEAD TO LATEX FAILURES
# AND IS THEREFORE UNSUPPORTED. PLEASE DO NOT ASK FOR HELP
# IF THIS FEATURE DOES NOT DO WHAT YOU EXPECT IT TO.
# text.latex.preamble is a single line of LaTeX code that
# will be passed on to the LaTeX system. It may contain
# any code that is valid for the LaTeX "preamble", i.e.
# between the "\documentclass" and "\begin{document}"
# statements.
# Note that it has to be put on a single line, which may
# become quite long.
# The following packages are always loaded with usetex, so
# beware of package collisions: color, geometry, graphicx,
# type1cm, textcomp.
# Adobe Postscript (PSSNFS) font packages may also be
# loaded, depending on your font settings.
## FreeType hinting flag ("foo" corresponds to FT_LOAD_FOO); may be one of the
## following (Proprietary Matplotlib-specific synonyms are given in parentheses,
## but their use is discouraged):
## - default: Use the font's native hinter if possible, else FreeType's auto-hinter.
## ("either" is a synonym).
## - no_autohint: Use the font's native hinter if possible, else don't hint.
## ("native" is a synonym.)
## - force_autohint: Use FreeType's auto-hinter. ("auto" is a synonym.)
## - no_hinting: Disable hinting. ("none" is a synonym.)
#text.hinting: force_autohint
#text.hinting_factor: 8 # Specifies the amount of softness for hinting in the
# horizontal direction. A value of 1 will hint to full
# pixels. A value of 2 will hint to half pixels etc.
#text.kerning_factor : 0 # Specifies the scaling factor for kerning values. This
# is provided solely to allow old test images to remain
# unchanged. Set to 6 to obtain previous behavior. Values
# other than 0 or 6 have no defined meaning.
#text.antialiased: True # If True (default), the text will be antialiased.
# This only affects the Agg backend.
## The following settings allow you to select the fonts in math mode.
#mathtext.fontset: dejavusans # Should be 'dejavusans' (default),
# 'dejavuserif', 'cm' (Computer Modern), 'stix',
# 'stixsans' or 'custom' (unsupported, may go
# away in the future)
## "mathtext.fontset: custom" is defined by the mathtext.bf, .cal, .it, ...
## settings which map a TeX font name to a fontconfig font pattern. (These
## settings are not used for other font sets.)
#mathtext.bf: sans:bold
#mathtext.cal: cursive
#mathtext.it: sans:italic
#mathtext.rm: sans
#mathtext.sf: sans
#mathtext.tt: monospace
#mathtext.fallback: cm # Select fallback font from ['cm' (Computer Modern), 'stix'
# 'stixsans'] when a symbol can not be found in one of the
# custom math fonts. Select 'None' to not perform fallback
# and replace the missing character by a dummy symbol.
#mathtext.default: it # The default font to use for math.
# Can be any of the LaTeX font names, including
# the special name "regular" for the same font
# used in regular text.
## ***************************************************************************
## * AXES *
## ***************************************************************************
## Following are default face and edge colors, default tick sizes,
## default fontsizes for ticklabels, and so on. See
## https://matplotlib.org/api/axes_api.html#module-matplotlib.axes
#axes.facecolor: white # axes background color
#axes.edgecolor: black # axes edge color
#axes.linewidth: 0.8 # edge linewidth
#axes.grid: False # display grid or not
#axes.grid.axis: both # which axis the grid should apply to
#axes.grid.which: major # gridlines at {major, minor, both} ticks
#axes.titlelocation: center # alignment of the title: {left, right, center}
#axes.titlesize: large # fontsize of the axes title
#axes.titleweight: normal # font weight of title
#axes.titlecolor: auto # color of the axes title, auto falls back to
# text.color as default value
#axes.titley: None # position title (axes relative units). None implies auto
#axes.titlepad: 6.0 # pad between axes and title in points
#axes.labelsize: medium # fontsize of the x any y labels
#axes.labelpad: 4.0 # space between label and axis
#axes.labelweight: normal # weight of the x and y labels
#axes.labelcolor: black
#axes.axisbelow: line # draw axis gridlines and ticks:
# - below patches (True)
# - above patches but below lines ('line')
# - above all (False)
#axes.formatter.limits: -5, 6 # use scientific notation if log10
# of the axis range is smaller than the
# first or larger than the second
#axes.formatter.use_locale: False # When True, format tick labels
# according to the user's locale.
# For example, use ',' as a decimal
# separator in the fr_FR locale.
#axes.formatter.use_mathtext: False # When True, use mathtext for scientific
# notation.
#axes.formatter.min_exponent: 0 # minimum exponent to format in scientific notation
#axes.formatter.useoffset: True # If True, the tick label formatter
# will default to labeling ticks relative
# to an offset when the data range is
# small compared to the minimum absolute
# value of the data.
#axes.formatter.offset_threshold: 4 # When useoffset is True, the offset
# will be used when it can remove
# at least this number of significant
# digits from tick labels.
#axes.spines.left: True # display axis spines
#axes.spines.bottom: True
#axes.spines.top: True
#axes.spines.right: True
#axes.unicode_minus: True # use Unicode for the minus symbol rather than hyphen. See
# https://en.wikipedia.org/wiki/Plus_and_minus_signs#Character_codes
#axes.prop_cycle: cycler('color', ['1f77b4', 'ff7f0e', '2ca02c', 'd62728', '9467bd', '8c564b', 'e377c2', '7f7f7f', 'bcbd22', '17becf'])
# color cycle for plot lines as list of string colorspecs:
# single letter, long name, or web-style hex
# As opposed to all other paramters in this file, the color
# values must be enclosed in quotes for this parameter,
# e.g. '1f77b4', instead of 1f77b4.
# See also https://matplotlib.org/tutorials/intermediate/color_cycle.html
# for more details on prop_cycle usage.
#axes.autolimit_mode: data # How to scale axes limits to the data. By using:
# - "data" to use data limits, plus some margin
# - "round_numbers" move to the nearest "round" number
#axes.xmargin: .05 # x margin. See `axes.Axes.margins`
#axes.ymargin: .05 # y margin. See `axes.Axes.margins`
#polaraxes.grid: True # display grid on polar axes
#axes3d.grid: True # display grid on 3d axes
## ***************************************************************************
## * AXIS *
## ***************************************************************************
#xaxis.labellocation: center # alignment of the xaxis label: {left, right, center}
#yaxis.labellocation: center # alignment of the yaxis label: {bottom, top, center}
## ***************************************************************************
## * DATES *
## ***************************************************************************
## These control the default format strings used in AutoDateFormatter.
## Any valid format datetime format string can be used (see the python
## `datetime` for details). For example, by using:
## - '%%x' will use the locale date representation
## - '%%X' will use the locale time representation
## - '%%c' will use the full locale datetime representation
## These values map to the scales:
## {'year': 365, 'month': 30, 'day': 1, 'hour': 1/24, 'minute': 1 / (24 * 60)}
#date.autoformatter.year: %Y
#date.autoformatter.month: %Y-%m
#date.autoformatter.day: %Y-%m-%d
#date.autoformatter.hour: %m-%d %H
#date.autoformatter.minute: %d %H:%M
#date.autoformatter.second: %H:%M:%S
#date.autoformatter.microsecond: %M:%S.%f
## The reference date for Matplotlib's internal date representation
## See https://matplotlib.org/examples/ticks_and_spines/date_precision_and_epochs.py
#date.epoch: 1970-01-01T00:00:00
## ***************************************************************************
## * TICKS *
## ***************************************************************************
## See https://matplotlib.org/api/axis_api.html#matplotlib.axis.Tick
#xtick.top: False # draw ticks on the top side
#xtick.bottom: True # draw ticks on the bottom side
#xtick.labeltop: False # draw label on the top
#xtick.labelbottom: True # draw label on the bottom
#xtick.major.size: 3.5 # major tick size in points
#xtick.minor.size: 2 # minor tick size in points
#xtick.major.width: 0.8 # major tick width in points
#xtick.minor.width: 0.6 # minor tick width in points
#xtick.major.pad: 3.5 # distance to major tick label in points
#xtick.minor.pad: 3.4 # distance to the minor tick label in points
#xtick.color: black # color of the tick labels
#xtick.labelsize: medium # fontsize of the tick labels
#xtick.direction: out # direction: {in, out, inout}
#xtick.minor.visible: False # visibility of minor ticks on x-axis
#xtick.major.top: True # draw x axis top major ticks
#xtick.major.bottom: True # draw x axis bottom major ticks
#xtick.minor.top: True # draw x axis top minor ticks
#xtick.minor.bottom: True # draw x axis bottom minor ticks
#xtick.alignment: center # alignment of xticks
#ytick.left: True # draw ticks on the left side
#ytick.right: False # draw ticks on the right side
#ytick.labelleft: True # draw tick labels on the left side
#ytick.labelright: False # draw tick labels on the right side
#ytick.major.size: 3.5 # major tick size in points
#ytick.minor.size: 2 # minor tick size in points
#ytick.major.width: 0.8 # major tick width in points
#ytick.minor.width: 0.6 # minor tick width in points
#ytick.major.pad: 3.5 # distance to major tick label in points
#ytick.minor.pad: 3.4 # distance to the minor tick label in points
#ytick.color: black # color of the tick labels
#ytick.labelsize: medium # fontsize of the tick labels
#ytick.direction: out # direction: {in, out, inout}
#ytick.minor.visible: False # visibility of minor ticks on y-axis
#ytick.major.left: True # draw y axis left major ticks
#ytick.major.right: True # draw y axis right major ticks
#ytick.minor.left: True # draw y axis left minor ticks
#ytick.minor.right: True # draw y axis right minor ticks
#ytick.alignment: center_baseline # alignment of yticks
## ***************************************************************************
## * GRIDS *
## ***************************************************************************
#grid.color: b0b0b0 # grid color
#grid.linestyle: - # solid
#grid.linewidth: 0.8 # in points
#grid.alpha: 1.0 # transparency, between 0.0 and 1.0
## ***************************************************************************
## * LEGEND *
## ***************************************************************************
#legend.loc: best
#legend.frameon: True # if True, draw the legend on a background patch
#legend.framealpha: 0.8 # legend patch transparency
#legend.facecolor: inherit # inherit from axes.facecolor; or color spec
#legend.edgecolor: 0.8 # background patch boundary color
#legend.fancybox: True # if True, use a rounded box for the
# legend background, else a rectangle
#legend.shadow: False # if True, give background a shadow effect
#legend.numpoints: 1 # the number of marker points in the legend line
#legend.scatterpoints: 1 # number of scatter points
#legend.markerscale: 1.0 # the relative size of legend markers vs. original
#legend.fontsize: medium
#legend.title_fontsize: None # None sets to the same as the default axes.
## Dimensions as fraction of fontsize:
#legend.borderpad: 0.4 # border whitespace
#legend.labelspacing: 0.5 # the vertical space between the legend entries
#legend.handlelength: 2.0 # the length of the legend lines
#legend.handleheight: 0.7 # the height of the legend handle
#legend.handletextpad: 0.8 # the space between the legend line and legend text
#legend.borderaxespad: 0.5 # the border between the axes and legend edge
#legend.columnspacing: 2.0 # column separation
## ***************************************************************************
## * FIGURE *
## ***************************************************************************
## See https://matplotlib.org/api/figure_api.html#matplotlib.figure.Figure
#figure.titlesize: large # size of the figure title (``Figure.suptitle()``)
#figure.titleweight: normal # weight of the figure title
#figure.figsize: 6.4, 4.8 # figure size in inches
#figure.dpi: 100 # figure dots per inch
#figure.facecolor: white # figure facecolor
#figure.edgecolor: white # figure edgecolor
#figure.frameon: True # enable figure frame
#figure.max_open_warning: 20 # The maximum number of figures to open through
# the pyplot interface before emitting a warning.
# If less than one this feature is disabled.
#figure.raise_window : True # Raise the GUI window to front when show() is called.
## The figure subplot parameters. All dimensions are a fraction of the figure width and height.
#figure.subplot.left: 0.125 # the left side of the subplots of the figure
#figure.subplot.right: 0.9 # the right side of the subplots of the figure
#figure.subplot.bottom: 0.11 # the bottom of the subplots of the figure
#figure.subplot.top: 0.88 # the top of the subplots of the figure
#figure.subplot.wspace: 0.2 # the amount of width reserved for space between subplots,
# expressed as a fraction of the average axis width
#figure.subplot.hspace: 0.2 # the amount of height reserved for space between subplots,
# expressed as a fraction of the average axis height
## Figure layout
#figure.autolayout: False # When True, automatically adjust subplot
# parameters to make the plot fit the figure
# using `tight_layout`
#figure.constrained_layout.use: False # When True, automatically make plot
# elements fit on the figure. (Not
# compatible with `autolayout`, above).
#figure.constrained_layout.h_pad: 0.04167 # Padding around axes objects. Float representing
#figure.constrained_layout.w_pad: 0.04167 # inches. Default is 3./72. inches (3 pts)
#figure.constrained_layout.hspace: 0.02 # Space between subplot groups. Float representing
#figure.constrained_layout.wspace: 0.02 # a fraction of the subplot widths being separated.
## ***************************************************************************
## * IMAGES *
## ***************************************************************************
#image.aspect: equal # {equal, auto} or a number
#image.interpolation: antialiased # see help(imshow) for options
#image.cmap: viridis # A colormap name, gray etc...
#image.lut: 256 # the size of the colormap lookup table
#image.origin: upper # {lower, upper}
#image.resample: True
#image.composite_image: True # When True, all the images on a set of axes are
# combined into a single composite image before
# saving a figure as a vector graphics file,
# such as a PDF.
## ***************************************************************************
## * CONTOUR PLOTS *
## ***************************************************************************
#contour.negative_linestyle: dashed # string or on-off ink sequence
#contour.corner_mask: True # {True, False, legacy}
#contour.linewidth: None # {float, None} Size of the contour
# linewidths. If set to None,
# it falls back to `line.linewidth`.
## ***************************************************************************
## * ERRORBAR PLOTS *
## ***************************************************************************
#errorbar.capsize: 0 # length of end cap on error bars in pixels
## ***************************************************************************
## * HISTOGRAM PLOTS *
## ***************************************************************************
#hist.bins: 10 # The default number of histogram bins or 'auto'.
## ***************************************************************************
## * SCATTER PLOTS *
## ***************************************************************************
#scatter.marker: o # The default marker type for scatter plots.
#scatter.edgecolors: face # The default edge colors for scatter plots.
## ***************************************************************************
## * AGG RENDERING *
## ***************************************************************************
## Warning: experimental, 2008/10/10
#agg.path.chunksize: 0 # 0 to disable; values in the range
# 10000 to 100000 can improve speed slightly
# and prevent an Agg rendering failure
# when plotting very large data sets,
# especially if they are very gappy.
# It may cause minor artifacts, though.
# A value of 20000 is probably a good
# starting point.
## ***************************************************************************
## * PATHS *
## ***************************************************************************
#path.simplify: True # When True, simplify paths by removing "invisible"
# points to reduce file size and increase rendering
# speed
#path.simplify_threshold: 0.111111111111 # The threshold of similarity below
# which vertices will be removed in
# the simplification process.
#path.snap: True # When True, rectilinear axis-aligned paths will be snapped
# to the nearest pixel when certain criteria are met.
# When False, paths will never be snapped.
#path.sketch: None # May be None, or a 3-tuple of the form:
# (scale, length, randomness).
# - *scale* is the amplitude of the wiggle
# perpendicular to the line (in pixels).
# - *length* is the length of the wiggle along the
# line (in pixels).
# - *randomness* is the factor by which the length is
# randomly scaled.
#path.effects:
## ***************************************************************************
## * SAVING FIGURES *
## ***************************************************************************
## The default savefig params can be different from the display params
## e.g., you may want a higher resolution, or to make the figure
## background white
#savefig.dpi: figure # figure dots per inch or 'figure'
#savefig.facecolor: auto # figure facecolor when saving
#savefig.edgecolor: auto # figure edgecolor when saving
#savefig.format: png # {png, ps, pdf, svg}
#savefig.bbox: standard # {tight, standard}
# 'tight' is incompatible with pipe-based animation
# backends (e.g. 'ffmpeg') but will work with those
# based on temporary files (e.g. 'ffmpeg_file')
#savefig.pad_inches: 0.1 # Padding to be used when bbox is set to 'tight'
#savefig.directory: ~ # default directory in savefig dialog box,
# leave empty to always use current working directory
#savefig.transparent: False # setting that controls whether figures are saved with a
# transparent background by default
#savefig.orientation: portrait # Orientation of saved figure
### tk backend params
#tk.window_focus: False # Maintain shell focus for TkAgg
### ps backend params
#ps.papersize: letter # {auto, letter, legal, ledger, A0-A10, B0-B10}
#ps.useafm: False # use of afm fonts, results in small files
#ps.usedistiller: False # {ghostscript, xpdf, None}
# Experimental: may produce smaller files.
# xpdf intended for production of publication quality files,
# but requires ghostscript, xpdf and ps2eps
#ps.distiller.res: 6000 # dpi
#ps.fonttype: 3 # Output Type 3 (Type3) or Type 42 (TrueType)
### PDF backend params
#pdf.compression: 6 # integer from 0 to 9
# 0 disables compression (good for debugging)
#pdf.fonttype: 3 # Output Type 3 (Type3) or Type 42 (TrueType)
#pdf.use14corefonts : False
#pdf.inheritcolor: False
### SVG backend params
#svg.image_inline: True # Write raster image data directly into the SVG file
#svg.fonttype: path # How to handle SVG fonts:
# path: Embed characters as paths -- supported
# by most SVG renderers
# None: Assume fonts are installed on the
# machine where the SVG will be viewed.
#svg.hashsalt: None # If not None, use this string as hash salt instead of uuid4
### pgf parameter
## See https://matplotlib.org/tutorials/text/pgf.html for more information.
#pgf.rcfonts: True
#pgf.preamble: # See text.latex.preamble for documentation
#pgf.texsystem: xelatex
### docstring params
#docstring.hardcopy: False # set this when you want to generate hardcopy docstring
## ***************************************************************************
## * INTERACTIVE KEYMAPS *
## ***************************************************************************
## Event keys to interact with figures/plots via keyboard.
## See https://matplotlib.org/users/navigation_toolbar.html for more details on
## interactive navigation. Customize these settings according to your needs.
## Leave the field(s) empty if you don't need a key-map. (i.e., fullscreen : '')
#keymap.fullscreen: f, ctrl+f # toggling
#keymap.home: h, r, home # home or reset mnemonic
#keymap.back: left, c, backspace, MouseButton.BACK # forward / backward keys
#keymap.forward: right, v, MouseButton.FORWARD # for quick navigation
#keymap.pan: p # pan mnemonic
#keymap.zoom: o # zoom mnemonic
#keymap.save: s, ctrl+s # saving current figure
#keymap.help: f1 # display help about active tools
#keymap.quit: ctrl+w, cmd+w, q # close the current figure
#keymap.quit_all: # close all figures
#keymap.grid: g # switching on/off major grids in current axes
#keymap.grid_minor: G # switching on/off minor grids in current axes
#keymap.yscale: l # toggle scaling of y-axes ('log'/'linear')
#keymap.xscale: k, L # toggle scaling of x-axes ('log'/'linear')
#keymap.copy: ctrl+c, cmd+c # Copy figure to clipboard
## ***************************************************************************
## * ANIMATION *
## ***************************************************************************
#animation.html: none # How to display the animation as HTML in
# the IPython notebook:
# - 'html5' uses HTML5 video tag
# - 'jshtml' creates a Javascript animation
#animation.writer: ffmpeg # MovieWriter 'backend' to use
#animation.codec: h264 # Codec to use for writing movie
#animation.bitrate: -1 # Controls size/quality tradeoff for movie.
# -1 implies let utility auto-determine
#animation.frame_format: png # Controls frame format used by temp files
#animation.ffmpeg_path: ffmpeg # Path to ffmpeg binary. Without full path
# $PATH is searched
#animation.ffmpeg_args: # Additional arguments to pass to ffmpeg
#animation.convert_path: convert # Path to ImageMagick's convert binary.
# On Windows use the full path since convert
# is also the name of a system tool.
#animation.convert_args: # Additional arguments to pass to convert
#animation.embed_limit: 20.0 # Limit, in MB, of size of base64 encoded
# animation in HTML (i.e. IPython notebook)
#mpl_toolkits.legacy_colorbar: True