Contents
- Matplotlib Tutorial - 파이썬으로 데이터 시각화하기
- Matplotlib 설치하기
- Matplotlib 기본 사용
- Matplotlib 숫자 입력하기
- Matplotlib 축 레이블 설정하기
- Matplotlib 범례 표시하기
- Matplotlib 축 범위 지정하기
- Matplotlib 선 종류 지정하기
- Matplotlib 마커 지정하기
- Matplotlib 색상 지정하기
- Matplotlib 그래프 영역 채우기
- Matplotlib 축 스케일 지정하기
- Matplotlib 여러 곡선 그리기
- Matplotlib 그리드 설정하기
- Matplotlib 눈금 표시하기
- Matplotlib 타이틀 설정하기
- Matplotlib 수평선/수직선 표시하기
- Matplotlib 막대 그래프 그리기
- Matplotlib 수평 막대 그래프 그리기
- Matplotlib 산점도 그리기
- Matplotlib 3차원 산점도 그리기
- Matplotlib 히스토그램 그리기
- Matplotlib 에러바 표시하기
- Matplotlib 파이 차트 그리기
- Matplotlib 히트맵 그리기
- Matplotlib 여러 개의 그래프 그리기
- Matplotlib 컬러맵 설정하기
- Matplotlib 텍스트 삽입하기
- Matplotlib 수학적 표현 사용하기
- Matplotlib 그래프 스타일 설정하기
- Matplotlib 이미지 저장하기
- Matplotlib 객체 지향 인터페이스 1
- Matplotlib 객체 지향 인터페이스 2
- Matplotlib 축 위치 조절하기
- Matplotlib 이중 Y축 표시하기
- Matplotlib 두 종류의 그래프 그리기
- Matplotlib 박스 플롯 그리기
- Matplotlib 바이올린 플롯 그리기
- Matplotlib 다양한 도형 삽입하기
- Matplotlib 다양한 패턴 채우기
- Matplotlib 애니메이션 사용하기 1
- Matplotlib 애니메이션 사용하기 2
- Matplotlib 3차원 Surface 표현하기
- Matplotlib 트리맵 그리기 (Squarify)
- Matplotlib Inset 그래프 삽입하기
Tutorials
- Python Tutorial
- NumPy Tutorial
- Matplotlib Tutorial
- PyQt5 Tutorial
- BeautifulSoup Tutorial
- xlrd/xlwt Tutorial
- Pillow Tutorial
- Googletrans Tutorial
- PyWin32 Tutorial
- PyAutoGUI Tutorial
- Pyperclip Tutorial
- TensorFlow Tutorial
- Tips and Examples
Matplotlib 축 레이블 설정하기
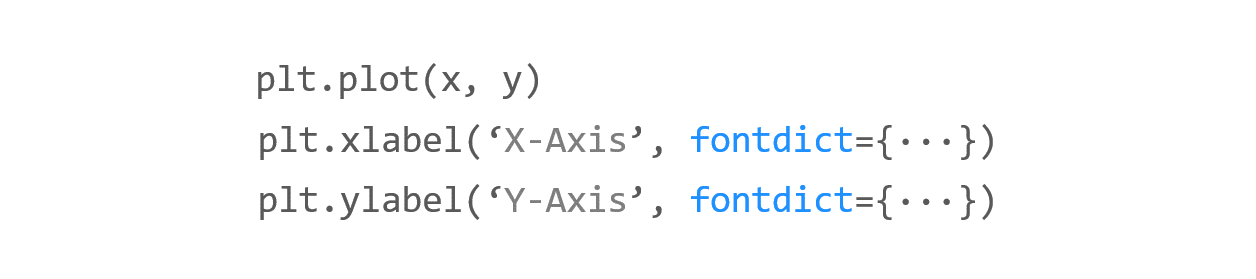
matplotlib.pyplot 모듈의 xlabel(), ylabel() 함수를 사용하면 그래프의 X, Y축에 대한 레이블을 표시할 수 있습니다.
이 페이지에서는 xlabel(), ylabel() 함수를 사용해서 그래프의 축에 레이블을 표시하는 방법에 대해 소개합니다.
Keyword: plt.xlabel(), plt.ylabel(), plt.axis(), labelpad, fontdict, loc
■ Table of Contents

2) 여백 지정하기

예제
import matplotlib.pyplot as plt

plt.plot([1, 2, 3, 4], [2, 3, 5, 10])
plt.xlabel('X-Axis', labelpad=15)
plt.ylabel('Y-Axis', labelpad=20)
plt.show()
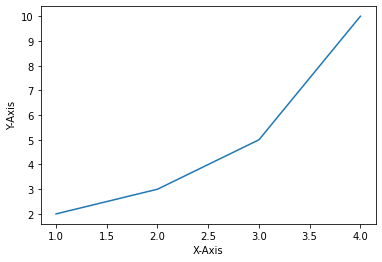
xlabel(), ylabel() 함수의 labelpad 파라미터는 축 레이블의 여백 (Padding)을 지정합니다.
예제에서는 X축 레이블에 대해서 15pt, Y축 레이블에 대해서 20pt 만큼의 여백을 지정했습니다.
결과는 아래와 같습니다.
Matplotlib 축 레이블 설정하기 - 여백 지정하기
3) 폰트 설정하기
예제
import matplotlib.pyplot as plt

plt.plot([1, 2, 3, 4], [2, 3, 5, 10])
plt.xlabel('X-Axis', labelpad=15, fontdict={'family': 'serif', 'color': 'b', 'weight': 'bold', 'size': 14})
plt.ylabel('Y-Axis', labelpad=20, fontdict={'family': 'fantasy', 'color': 'deeppink', 'weight': 'normal', 'size': 'xx-large'})
plt.show()
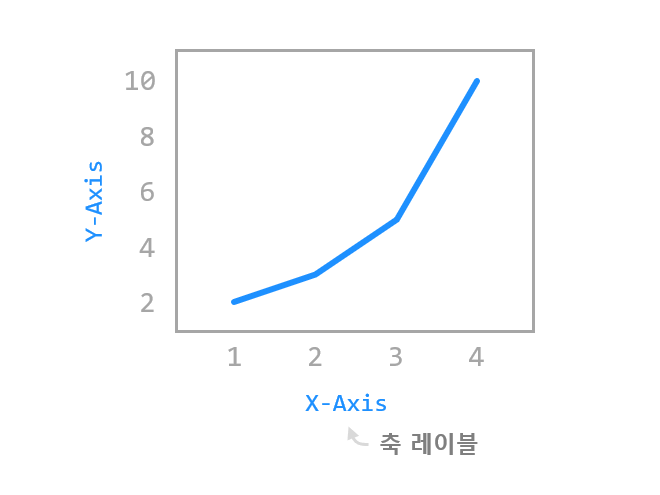
xlabel(), ylabel() 함수의 fontdict 파라미터를 사용하면 축 레이블의 폰트 스타일을 설정할 수 있습니다.
예제에서는 ‘family’, ‘color’, ‘weight’, ‘size’와 같은 속성을 사용해서 축 레이블 텍스트를 설정했습니다.
아래와 같이 작성하면 폰트 스타일을 편리하게 재사용할 수 있습니다.
import matplotlib.pyplot as plt

font1 = {'family': 'serif',
         'color': 'b',
         'weight': 'bold',
         'size': 14
         }

font2 = {'family': 'fantasy',
         'color': 'deeppink',
         'weight': 'normal',
         'size': 'xx-large'
         }

plt.plot([1, 2, 3, 4], [2, 3, 5, 10])
plt.xlabel('X-Axis', labelpad=15, fontdict=font1)
plt.ylabel('Y-Axis', labelpad=20, fontdict=font2)
plt.show()
결과는 아래와 같습니다.

Matplotlib 축 레이블 설정하기 - 폰트 설정하기
주요한 속성에 대한 설명과 옵션은 아래 표를 참고하세요.
Property |
Description |
Option |
|---|---|---|
alpha |
텍스트의 투명도 |
0.0 ~ 1.0 (float) |
color |
텍스트의 색상 |
Any Matplotlib color |
family |
텍스트의 글꼴 |
[FONTNAME | ‘serif’ | ‘sans-serif’ | ‘cursive’ | ‘fantasy’ | ‘monospace’ ] |
rotation |
텍스트의 회전각 |
[angle in degrees | ‘vertical’ | ‘horizontal’ ] |
size |
텍스트의 크기 |
[size in points | ‘xx-small’ | ‘x-small’ | ‘small’ | ‘medium’ | ‘large’ | ‘x-large’ | ‘xx-large’ ] |
weight |
텍스트의 굵기 |
[a numeric value in range 0-1000 | ‘ultralight’ | ‘light’ | ‘normal’ | ‘regular’ | ‘book’ | ‘medium’ | ‘roman’ | ‘semibold’ | ‘demibold’ | ‘demi’ | ‘bold’ | ‘heavy’ | ‘extra bold’ | ‘black’ ] |
4) 위치 지정하기

예제
import matplotlib.pyplot as plt

plt.plot([1, 2, 3, 4], [2, 3, 5, 10])
plt.xlabel('X-Axis', loc='right')
plt.ylabel('Y-Axis', loc='top')
plt.show()
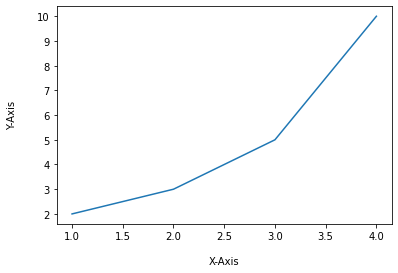
xlabel() 함수의 loc 파라미터는 X축 레이블의 위치를 지정합니다. ({‘left’, ‘center’, ‘right’})
ylabel() 함수의 loc 파라미터는 Y축 레이블의 위치를 지정합니다. ({‘bottom’, ‘center’, ‘top’})
이 파라미터는 Matplotlib 3.3 이후 버전부터 적용되었습니다.
결과는 아래와 같습니다.

Matplotlib 축 레이블 설정하기 - 위치 지정하기