Contents
- TensorFlow - 구글 머신러닝 플랫폼
- 1. 텐서 기초 살펴보기
- 2. 간단한 신경망 만들기
- 3. 손실 함수 살펴보기
- 4. 옵티마이저 사용하기
- 5. AND 로직 연산 학습하기
- 6. 뉴런층의 속성 확인하기
- 7. 뉴런층의 출력 확인하기
- 8. MNIST 손글씨 이미지 분류하기
- 9. Fashion MNIST 이미지 분류하기
- 10. 합성곱 신경망 사용하기
- 11. 말과 사람 이미지 분류하기
- 12. 고양이와 개 이미지 분류하기
- 13. 이미지 어그멘테이션의 효과
- 14. 전이 학습 활용하기
- 15. 다중 클래스 분류 문제
- 16. 시냅스 가중치 얻기
- 17. 시냅스 가중치 적용하기
- 18. 모델 시각화하기
- 19. 훈련 과정 시각화하기
- 20. 모델 저장하고 복원하기
- 21. 시계열 데이터 예측하기
- 22. 자연어 처리하기 1
- 23. 자연어 처리하기 2
- 24. 자연어 처리하기 3
- 25. Reference
- tf.cast
- tf.constant
- tf.keras.activations.exponential
- tf.keras.activations.linear
- tf.keras.activations.relu
- tf.keras.activations.sigmoid
- tf.keras.activations.softmax
- tf.keras.activations.tanh
- tf.keras.datasets
- tf.keras.layers.Conv2D
- tf.keras.layers.Dense
- tf.keras.layers.Flatten
- tf.keras.layers.GlobalAveragePooling2D
- tf.keras.layers.InputLayer
- tf.keras.layers.ZeroPadding2D
- tf.keras.metrics.Accuracy
- tf.keras.metrics.BinaryAccuracy
- tf.keras.Sequential
- tf.linspace
- tf.ones
- tf.random.normal
- tf.range
- tf.rank
- tf.TensorShape
- tf.zeros
Tutorials
- Python Tutorial
- NumPy Tutorial
- Matplotlib Tutorial
- PyQt5 Tutorial
- BeautifulSoup Tutorial
- xlrd/xlwt Tutorial
- Pillow Tutorial
- Googletrans Tutorial
- PyWin32 Tutorial
- PyAutoGUI Tutorial
- Pyperclip Tutorial
- TensorFlow Tutorial
- Tips and Examples
18. 모델 시각화하기
plot_model()을 이용하면 Sequential()으로 구성한 신경망 모델을 시각화할 수 있습니다.
에러가 발생하는 경우 페이지 아래 내용을 참고하세요.
예제
import tensorflow as tf
from tensorflow.keras.utils import plot_model

# 1. MNIST 데이터셋 임포트
mnist = tf.keras.datasets.mnist
(x_train, y_train), (x_test, y_test) = mnist.load_data()

# 2. 데이터 전처리
x_train, x_test = x_train/255.0, x_test/255.0

# 3. 모델 구성
model = tf.keras.models.Sequential([
    tf.keras.layers.Flatten(input_shape=(28, 28)),
    tf.keras.layers.Dense(512, activation=tf.nn.relu),
    tf.keras.layers.Dense(10, activation=tf.nn.softmax)
])

plot_model(model, to_file='model.png')
plot_model(model, to_file='model_shapes.png', show_shapes=True)
plot_model()에 모델 (model)과 파일명을 지정해줌으로써 시각화된 결과를 이미지 파일로 저장할 수 있습니다.
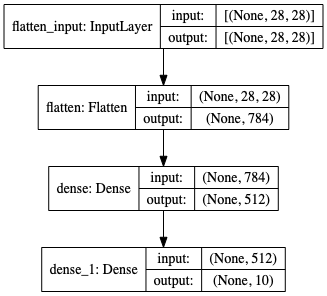
show_shapes을 True로 설정하면 층의 형태를 함께 시각화합니다.
결과는 아래와 같습니다.

그림. 모델 시각화하기 (without shapes).

그림. 모델 시각화하기 (with shapes).
에러가 발생하는 경우
pydot
Traceback (most recent call last):
  File "/Users/test.py", line 35, in <module>
    plot_model(model, to_file='model.png')
  File "/Users/anaconda3/lib/python3.5/site-packages/keras/utils/vis_utils.py", line 132, in plot_model
    dot = model_to_dot(model, show_shapes, show_layer_names, rankdir)
  File "/Users/anaconda3/lib/python3.5/site-packages/keras/utils/vis_utils.py", line 55, in model_to_dot
    _check_pydot()
  File "/Users/anaconda3/lib/python3.5/site-packages/keras/utils/vis_utils.py", line 20, in _check_pydot
    'Failed to import `pydot`. '
ImportError: Failed to import `pydot`. Please install `pydot`. For example with `pip install pydot`.

Process finished with exit code 1
위와 같은 에러가 발생하는 경우
pip install pydot
‘pip install pydot’을 이용해서 ‘pydot’을 설치하세요.
GraphViz
Traceback (most recent call last):
  File "/Users/test.py", line 35, in <module>
    plot_model(model, to_file='model.png')
  File "/Users/anaconda3/lib/python3.5/site-packages/keras/utils/vis_utils.py", line 132, in plot_model
    dot = model_to_dot(model, show_shapes, show_layer_names, rankdir)
  File "/Users/anaconda3/lib/python3.5/site-packages/keras/utils/vis_utils.py", line 55, in model_to_dot
    _check_pydot()
  File "/Users/anaconda3/lib/python3.5/site-packages/keras/utils/vis_utils.py", line 29, in _check_pydot
    '`pydot` failed to call GraphViz.'
OSError: `pydot` failed to call GraphViz.Please install GraphViz (https://www.graphviz.org/) and ensure that its executables are in the $PATH.
위와 같은 에러가 발생하는 경우
brew install graphviz
‘brew install graphviz’을 이용해서 ‘GraphViz’을 설치하세요.
import plot_model
from keras.utils import plot_model
from tensorflow.keras.utils import plot_model
plot_model을 임포트할 때, tenforflow와 keras를 혼용하지 않고, 아래와 같이 사용하세요.
이전글/다음글
이전글 : 17. 시냅스 가중치 적용하기
다음글 : 19. 훈련 과정 시각화하기