Contents
- TensorFlow - 구글 머신러닝 플랫폼
- 1. 텐서 기초 살펴보기
- 2. 간단한 신경망 만들기
- 3. 손실 함수 살펴보기
- 4. 옵티마이저 사용하기
- 5. AND 로직 연산 학습하기
- 6. 뉴런층의 속성 확인하기
- 7. 뉴런층의 출력 확인하기
- 8. MNIST 손글씨 이미지 분류하기
- 9. Fashion MNIST 이미지 분류하기
- 10. 합성곱 신경망 사용하기
- 11. 말과 사람 이미지 분류하기
- 12. 고양이와 개 이미지 분류하기
- 13. 이미지 어그멘테이션의 효과
- 14. 전이 학습 활용하기
- 15. 다중 클래스 분류 문제
- 16. 시냅스 가중치 얻기
- 17. 시냅스 가중치 적용하기
- 18. 모델 시각화하기
- 19. 훈련 과정 시각화하기
- 20. 모델 저장하고 복원하기
- 21. 시계열 데이터 예측하기
- 22. 자연어 처리하기 1
- 23. 자연어 처리하기 2
- 24. 자연어 처리하기 3
- 25. Reference
- tf.cast
- tf.constant
- tf.keras.activations.exponential
- tf.keras.activations.linear
- tf.keras.activations.relu
- tf.keras.activations.sigmoid
- tf.keras.activations.softmax
- tf.keras.activations.tanh
- tf.keras.datasets
- tf.keras.layers.Conv2D
- tf.keras.layers.Dense
- tf.keras.layers.Flatten
- tf.keras.layers.GlobalAveragePooling2D
- tf.keras.layers.InputLayer
- tf.keras.layers.ZeroPadding2D
- tf.keras.metrics.Accuracy
- tf.keras.metrics.BinaryAccuracy
- tf.keras.Sequential
- tf.linspace
- tf.ones
- tf.random.normal
- tf.range
- tf.rank
- tf.TensorShape
- tf.zeros
Tutorials
- Python Tutorial
- NumPy Tutorial
- Matplotlib Tutorial
- PyQt5 Tutorial
- BeautifulSoup Tutorial
- xlrd/xlwt Tutorial
- Pillow Tutorial
- Googletrans Tutorial
- PyWin32 Tutorial
- PyAutoGUI Tutorial
- Pyperclip Tutorial
- TensorFlow Tutorial
- Tips and Examples
19. 훈련 과정 시각화하기
신경망 모델의 훈련에 사용되는 fit() 메서드는 History 객체를 반환합니다.
History.history 속성은 훈련 과정에서 에포크 (epoch)에 따른 정확도 (accuracy) 와 같은 지표와 손실값 을 기록합니다.
또한 검증 (validation)의 지표와 손실값도 기록합니다.
아래의 코드는 10회의 훈련 과정에서 기록된 훈련 정확도 & 손실값 그리고 검증 정확도 & 손실값을 시각화합니다.
예제
import tensorflow as tf
import matplotlib.pyplot as plt


# 1. MNIST 데이터셋 임포트
mnist = tf.keras.datasets.mnist
(x_train, y_train), (x_test, y_test) = mnist.load_data()

# 2. 데이터 전처리
x_train, x_test = x_train/255.0, x_test/255.0

# 3. 모델 구성
model = tf.keras.models.Sequential([
    tf.keras.layers.Flatten(input_shape=(28, 28)),
    tf.keras.layers.Dense(512, activation=tf.nn.relu),
    tf.keras.layers.Dense(10, activation=tf.nn.softmax)
])

# 4. 모델 컴파일
model.compile(optimizer='adam',
              loss='sparse_categorical_crossentropy',
              metrics=['accuracy'])

# 5. 모델 훈련
history = model.fit(x_train, y_train, validation_split=0.25, epochs=10, verbose=1)
print(history.history)

# 6 훈련 과정 시각화 (정확도)
plt.plot(history.history['accuracy'])
plt.plot(history.history['val_accuracy'])
plt.title('Model accuracy')
plt.xlabel('Epoch')
plt.ylabel('Accuracy')
plt.legend(['Train', 'Test'], loc='upper left')
plt.show()

# 7 훈련 과정 시각화 (손실)
plt.plot(history.history['loss'])
plt.plot(history.history['val_loss'])
plt.title('Model loss')
plt.xlabel('Epoch')
plt.ylabel('Loss')
plt.legend(['Train', 'Test'], loc='upper left')
plt.show()
model.fit()에 훈련 데이터를 입력해줍니다.
validation_split은 0에서 1 사이의 값입니다. 0.25로 설정해주면 훈련 데이터의 25%를 검증에 사용합니다.
따라서 아래와 같이 60,000개의 데이터 중 45000개를 훈련에 사용하고 15,000개를 검증에 사용합니다.
Train on 45000 samples, validate on 15000 samples
Epoch 1/10
   32/45000 [..............................] - ETA: 3:20 - loss: 2.3440 - accuracy: 0.0938
  416/45000 [..............................] - ETA: 21s - loss: 1.6479 - accuracy: 0.5721
  736/45000 [..............................] - ETA: 14s - loss: 1.3261 - accuracy: 0.6467
 1088/45000 [..............................] - ETA: 12s - loss: 1.0996 - accuracy: 0.7040
 1408/45000 [..............................] - ETA: 11s - loss: 0.9780 - accuracy: 0.7294
 1632/45000 [>.............................] - ETA: 11s - loss: 0.9111 - accuracy: 0.7445
 1792/45000 [>.............................] - ETA: 11s - loss: 0.8627 - accuracy: 0.7589
 2048/45000 [>.............................] - ETA: 10s - loss: 0.8037 - accuracy: 0.7739
 2432/45000 [>.............................] - ETA: 10s - loss: 0.7423 - accuracy: 0.7903
print(history.history)을 통해 출력된 결과는 아래와 같습니다.
{'accuracy': [0.9335778, 0.9725556, 0.9815556, 0.9874222, 0.9913778, 0.99322224, 0.9945111, 0.99597776, 0.99635553, 0.99664444],
 'val_loss': [0.13596169148484866, 0.10232374267478785, 0.09159363598103325, 0.08637172984133164, 0.09674505230680419, 0.09105636464593311, 0.09010037897935448, 0.09504081677481688, 0.09993200332935667, 0.10999317096428277],
  'loss': [0.2266461635907491, 0.09062119808826181, 0.0589320162879924, 0.04020388817155165, 0.027329568712951408, 0.02126024063843199, 0.017342214744481155, 0.013346235364758307, 0.012164281833562482, 0.009792077704742164],
   'val_accuracy': [0.95993334, 0.9709333, 0.9734667, 0.976, 0.9734, 0.9754, 0.9766, 0.9781333, 0.9758667, 0.9764]}
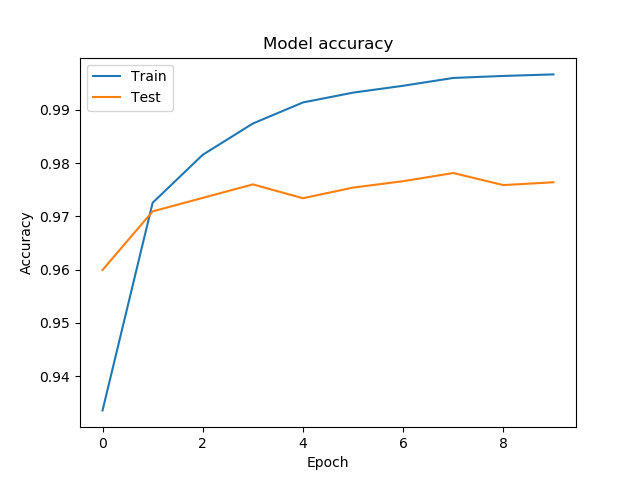
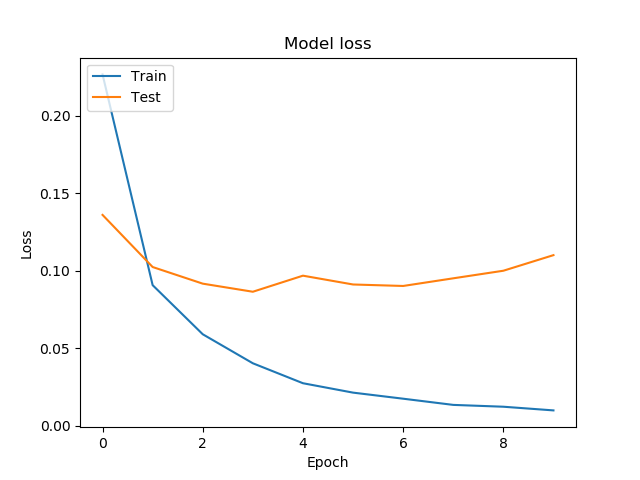
‘accuracy’, ‘val_accuracy’, ‘loss’, ‘val_loss’와 같은 키 값을 이용해서 훈련 과정의 에포크에 따른 정확도, 손실값을 얻을 수 있습니다.
그래프로 나타낸 훈련 과정의 정확도와 손실은 아래와 같습니다.

그림. 훈련 과정의 정확도 시각화하기.

그림. 훈련 과정의 손실 시각화하기.
관련 페이지
이전글/다음글
이전글 : 18. 모델 시각화하기
다음글 : 20. 모델 저장하고 복원하기